Hallo,
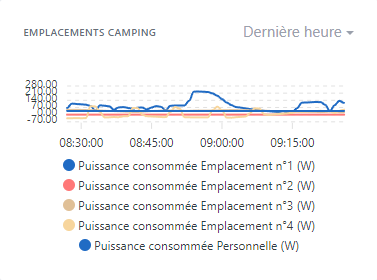
Wenn man ein Diagramm mit Legenden erstellt, wird der visuelle Teil des Diagramms in Abhängigkeit von der Anzahl der Legenden reduziert. Infolgedessen landet man ab einer bestimmten Anzahl von Legenden mit einem praktisch unleserlichen Diagramm.
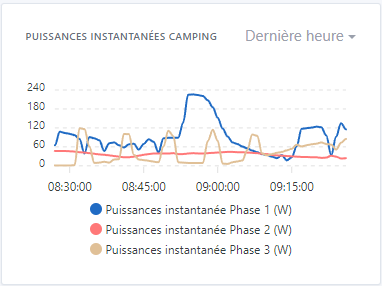
Beispiel mit 3 Legenden:
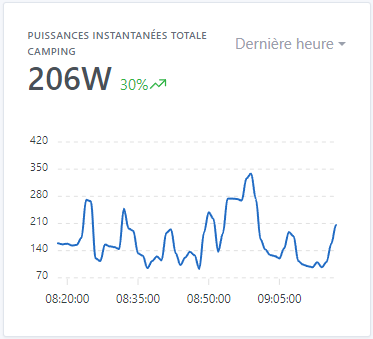
Ohne Legenden:
Könnten wir den Teil ohne Legenden fixieren und die Box entsprechend der Anzahl der Legenden vergrößern, oder zumindest eine Mindesthöhe des Diagramms festlegen, die eine Lesbarkeit ermöglicht (das Minimum wäre die mit 3 Legenden. Ab 4 wird es kaum noch lesbar.
GitHub-Issue:
ouvert 07:41AM - 24 Sep 23 UTC
fermé 08:37PM - 01 Dec 23 UTC
stale
First, are you sure that you found a Gladys bug?
If you are not sure, you can… come discuss with us on our community, in [french](http://community.gladysassistant.com/) or [english](https://en-community.gladysassistant.com/) 🙂
**Describe the bug**
When you create a chart with legends, the visual part of the chart reduces depending on the number of legends. As a result, we find ourselves from a certain number of legends with a practically illegible graph.
**To Reproduce**
Steps to reproduce the behavior:
- On the dashboard, add a “graphics” box
- Add more than 3 features
- Record and observe
**Expected behavior**
Could we fix the part without legend, and enlarge the box according to the number of legends, or at least set a minimum value of graph height allowing reading (the minimum being that with 3 legends. From 4 this becomes perhaps legible.
**Screenshots**
Example with 5 captions:

Example with 3 legends:

Without caption:

**Your Gladys installation (please complete the following information):**
- Raspberry Pi 4 Modèle B - SSD 512Go
**Desktop (please complete the following information):**
- OS: Microsoft Windows 10 Professionnel x64
- Chrome
- Version 116.0.5845.188 (Build officiel) (64 bits)
Danke, dass du das Issue erstellt hast!
Ich habe den Titel aktualisiert