Feature description
Hello,
The charts allow displaying details for the last hour
Hi @Jluc ![]()
I know you bumped this thread on another topic; next time bump it just here, it’s best — it avoids mixing topics.
I agree with you that this is an important subject; would any developer be willing to take it on?
Specifically, this file needs to be modified to refine the data sources used based on the display duration:
The current implementation aggregates the data too much, too quickly
A small contribution to this discussion:
Today, the ‹ Last hour › and ‹ Last 24h › charts display precise data, and the others display averaged values. I find this quite relevant, but it prevents one thing in my opinion: visually comparing today’s precise values with those from one or two days earlier, or the evolution over the last month compared to the same evolution in the previous month…
From a UX perspective, I would find it useful to add one of the following behaviors (or both):
- A new option « Last 3 days », which would display precise, non-averaged data from 00:00 two days ago
- or a ‹ navigation › system within a chart that would allow moving back in time:
- if ‹ Last 24h › is displayed, the chart would by default show the precise data for the last 24 hours, and two buttons ‹ < › and ‹ > › would allow switching to the previous/next 24 hours. For example:
- if ‹ Last 30 days › is displayed, the chart would by default show averaged data over the last 30 days, and two buttons ‹ < › and ‹ > › would allow switching to the precise values for the previous/next 30 days

Hi everyone ![]()
I think this feature request is resolved following the move to DuckDB! From now on, no more aggregated data, only raw data, even in the past, so you should now be able to better see the variations.
Can I close this request?
I think so! What a pleasure to navigate the charts!!! (it will be even better with the new version of the charts that @Terdious is preparing ![]() )
)
Hello !!
For my part, it’s not quite there yet (although pretty good already ^^)
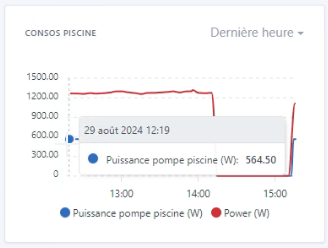
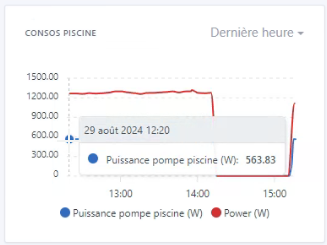
Here for example in « Last hour », I have data every 1 minute.
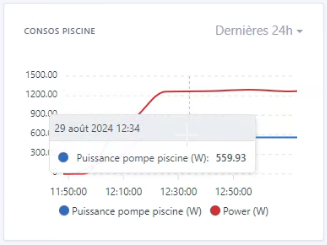
But if I zoom on the « Last 24h » chart:


I have a value every 15 minutes so they’re aggregated (better than before but still). So depending on the need to visualize the history (for example with strong fluctuations) we won’t get the expected values and worse (see below for the same hour), we can be misled by false data considered real. That said, I agree that as a rough idea it’s perfect like this. But the zoom should fetch the real data (development in progress)

or


For a trend and a quick overview, we’re very good, no contest. But for precise data (the initial request) we’re not there yet.
My personal opinion … ![]()
If I’m not mistaken, the development you’re currently working on with the charts would solve these problems, wouldn’t it?


I quietly tested the v1 he made… Light… ![]()
At first glance, it looks great, I really like the design!
Yeah, I had to push him a bit, the first version was really terrible ![]()