Displaying sensor curves on the dashboard

Hello everyone!

I’m creating this feature request even though it’s already quite advanced so that we can discuss it together on the forum and not just on GitHub.

For the timeline, @euguuu had started a first technical specification and had a first PR by the end of 2020. It was super complete and in terms of research, he went very far!! :slight_smile:

However, the PR was not finished, and I did not agree with all the technical choices that had been made, so I started working on another PR from scratch based on the same research, but with a different implementation.

I started working on it this summer (mid-July), and it was not a simple development!

Concretely, my specification for this feature was:

  • Display sensor values in less than 50ms regardless of the dataset (even 2 million sensor values)
  • Ability to change the time frame in live by the dashboard user
  • A super simple and clear UI.
  • The background pre-calculation of aggregated sensor values should not slow down Gladys.
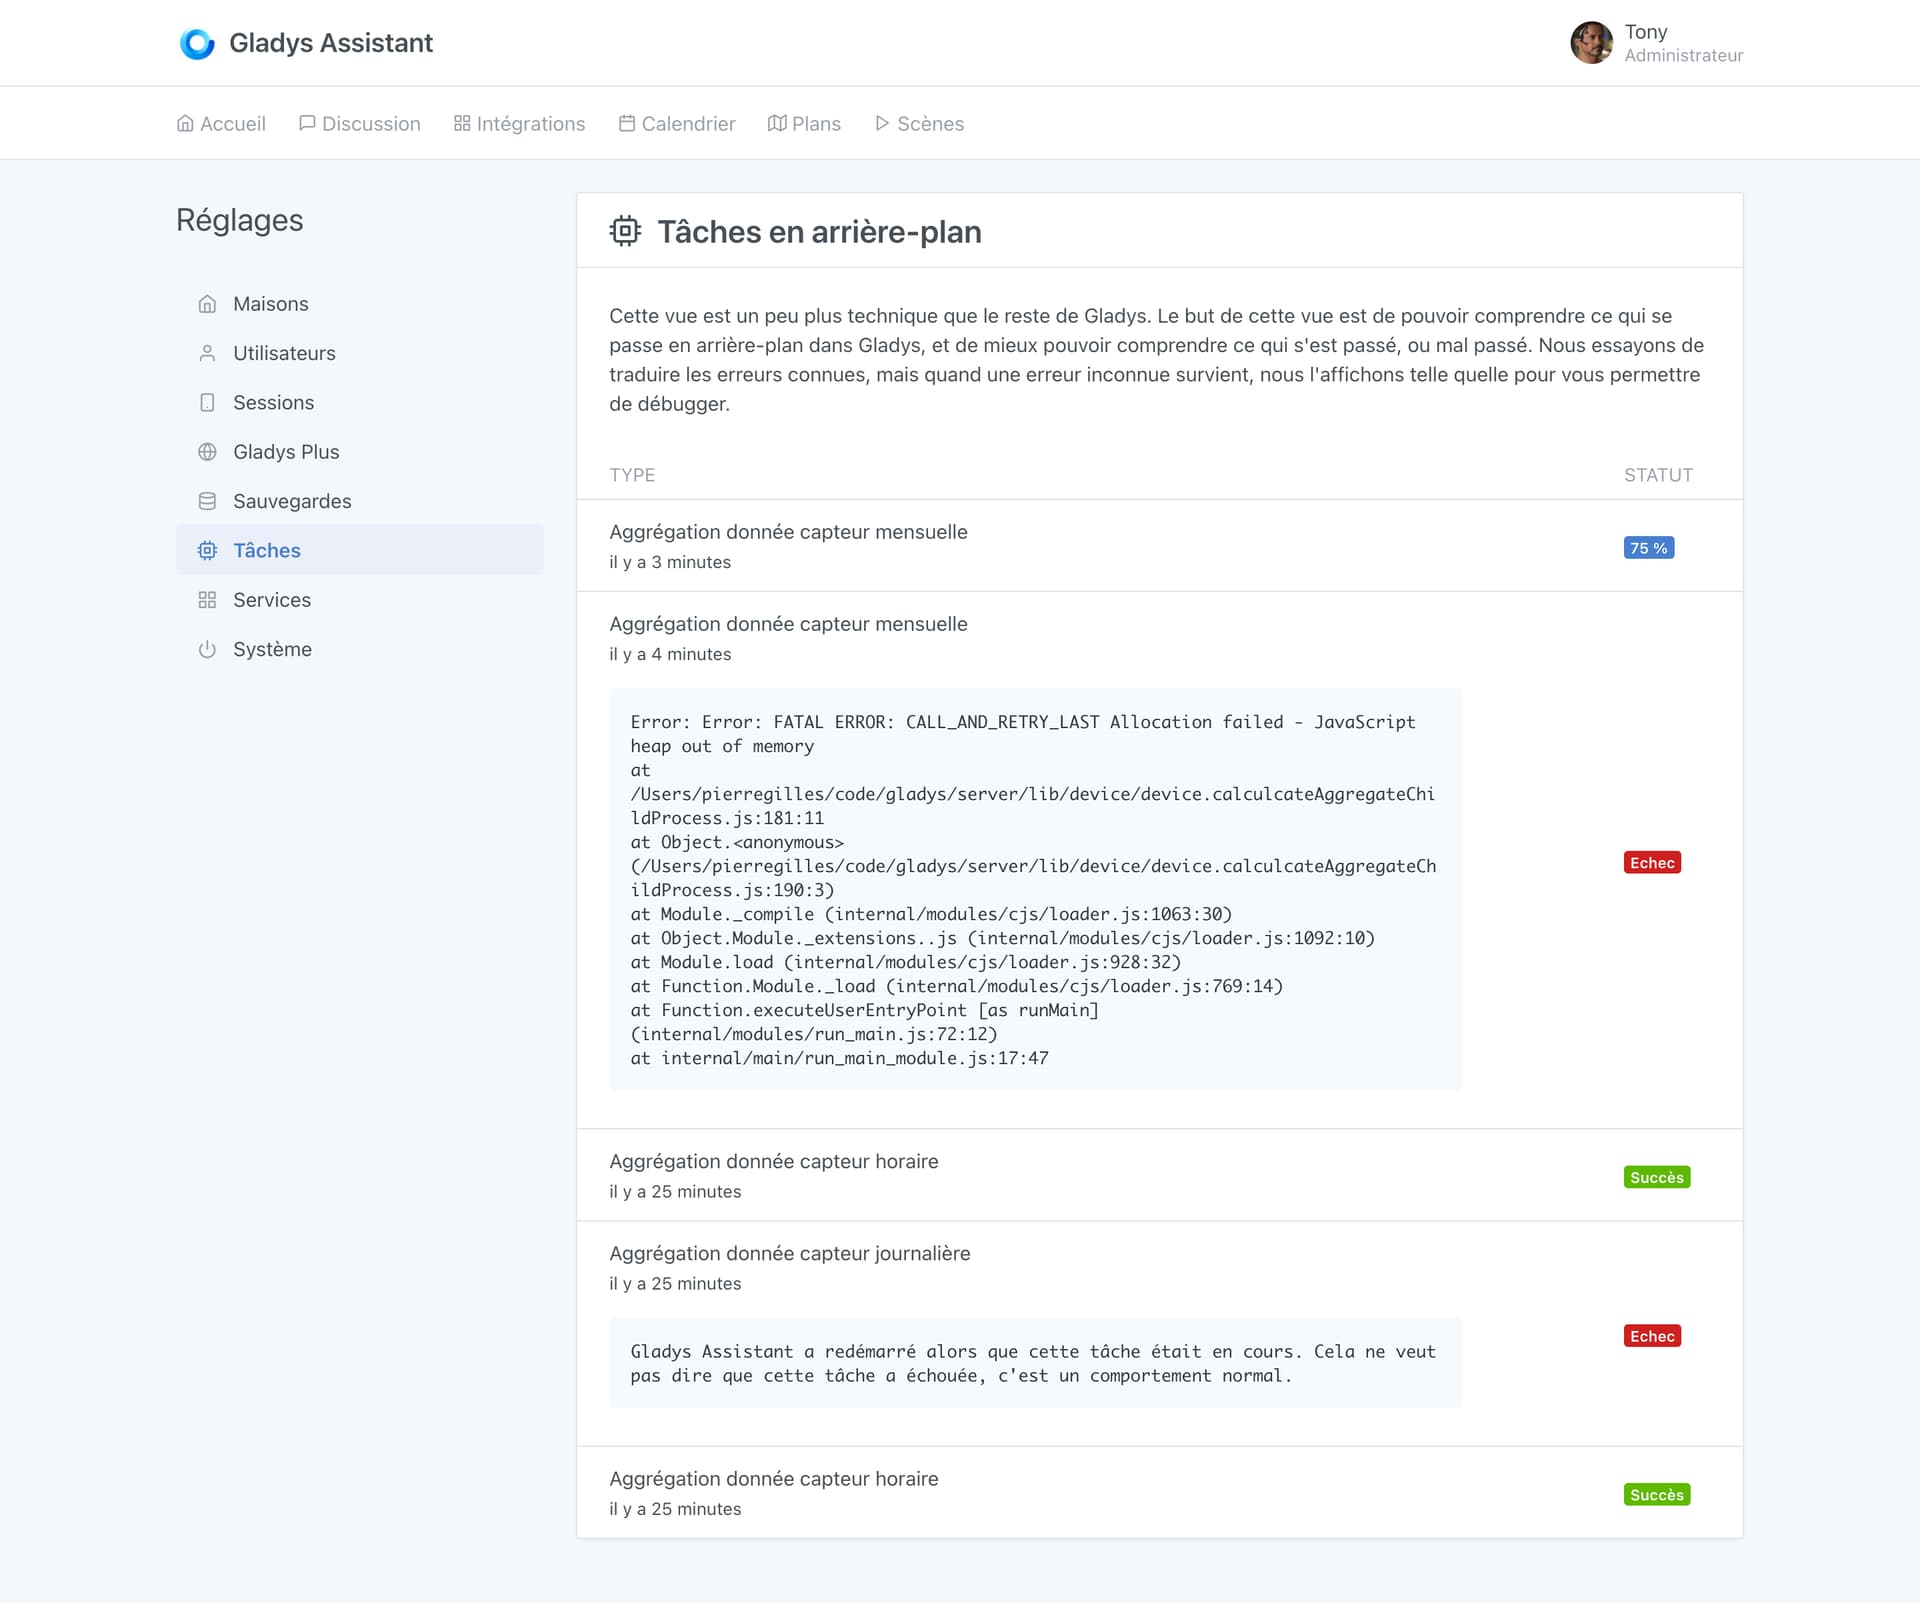
  • The user should be able to know if these sensor data have been aggregated or if something went wrong.

For now, it looks like this:

https://streamable.com/2utkhd

The big challenge of this development is to calculate in the background the aggregated sensor values, and to do it without slowing down Gladys, and while communicating with the user.

A new view therefore appears in Gladys, the « background tasks » view:

In the future, the goal is to integrate all background tasks (scenes, etc.) into this view to give the user more visibility into what is happening in the background in their Gladys.

My PR is available here:

I would appreciate any feedback @contributors :slight_smile:

To provide more details on the technical implementation, there are now 3 types of aggregations:

  • Hourly aggregations: we keep a maximum of 100 events per hour
  • Daily aggregations: we keep a maximum of 100 events per day
  • Monthly aggregations: we keep a maximum of 100 events per month

The goal is to be able to respond to queries with different time frames:

  • Give me the temperature of the last year (we use monthly data)
  • Give me the temperature of the last 10 minutes (live data)
  • Give me the temperature of the last 2 weeks (daily)

What do you think?

@Terdious If you have a bit of time (you tell me :p) it would be great if we could test this at your place before I merge, what do you think? :slight_smile:

With great pleasure!! We’ll find the time!!^^
Can we already test it?
As for timing (^^), when do you expect feedback at the latest?

@Terdious Yes you can test, the branch is in a working state!

Whenever you want, I will only deploy if people have tested it beforehand, so the sooner the better :slight_smile:

I provided my first feedback on GitHub.

I restored my production database but I only have 24 hours of data and I don’t know why.

Thanks for the super detailed feedback @VonOx!

Are you sure the aggregation went well, it’s not normal that you only have the last 24 hours

Do you have the logs?

In fact, it’s on my production database (device_state) that I only have 24H

You had to configure your production DB to only save 24 hours of data

There is a variable that defines the retention time

(That reminds me that we don’t expose this variable anywhere, I need to display it somewhere)

I must admit I’m not quite sure how I ended up with this ^^
image

I reset the value to 90

I just checked to test your integration, overall the functionality/UI is fine. I couldn’t really test your integration because my production instance has no data in the database. Basically, only the latest data exists. I didn’t touch anything specific to my production instance…

For this, it’s a Xiaomi sensor integrated via Zigbee2MQTT

I’m trying to figure out why it doesn’t store more data…

keep_history is set to one… I think there’s a bug…

Oh, same! I was looking for where that value was

2 people who have the same weird thing :smiley:

Yes, I was also looking on the UI and if others have this issue, it might be interesting to display it.

Weird all this, I’m going to investigate :slight_smile:

And yes, clearly we need to display the value in the UI now that we’re using the history

For information, @VonOx gave me some initial feedback on GitHub, which I just replied to here: Add the ability to vizualize device states on the dashboard by Pierre-Gilles · Pull Request #1248 · GladysAssistant/Gladys · GitHub

Lots of good feedback, both bug fixes and practical improvements to make the feature really useful for the end user.

This is exactly the kind of feedback I’m interested in, I want you to say whether you think it’s a useful and usable feature, or if something is missing.

The goal is to have something that is:

  • Very design-oriented
  • Configurable and flexible like Grafana
  • But very easy to use, with default values that do the work for you and provide a good result with minimal configuration.

So I’m going to improve my version and try to propose a corrected second iteration :slight_smile:

A small preview of what I’ve been working on since this morning: a clean display of errors in the « background tasks » view! :slight_smile:

I’ve always been against displaying raw logs in the UI (because we know what that leads to, then we get lazy and do integrations where we ask people to look for IDs in the logs :joy:), but I’m in favor of a view like this, where:

  • All known errors are translated, and the steps to follow are clearly explained for the user. Example here with a simple error: Gladys restarted while a task was running: this is normal behavior, and it should be specified.
  • For unknown errors, we display it as-is so the user can give us feedback, then two options:
    • It’s a bug, we fix the bug
    • It’s an error that can occur under certain conditions (not a bug): Example « OUT_OF_MEMORY »/« DISK FULL », etc… In this case, we add this error to the list of translated errors, with a clear message, and with steps to resolve the error.

Here’s what the view looks like for now:

What do you think? :slight_smile:

It’s morning :smirking_face:

It’s clear because the error is contextualized with respect to the task.

Access to the complete log could be a plus (it avoids the user having to use SSH) but that’s another topic.

:joy:

This is the complete error.

In the case of sensor aggregation, as Node.js is single-threaded, I didn’t want to block the main Gladys thread, so the aggregation is done in a separate worker.

The log displayed here is the complete error log sent by the worker, so there’s nothing more to see via SSH :slight_smile:

In any case, there normally shouldn’t be any errors. I added this precisely so that we’re ready for the day we push a mistake, or the day someone with a huge DB hits a technical limitation of their machine (so we can see it), but this case normally shouldn’t happen very frequently.

I was talking more about the general log, there you have the case of background tasks.

My idea was more for everything related to services, etc.
That’s why I said it was another topic.

The next step for me, and it’s a background task, is to add the execution of scenes to this view.

The goal is to be able to see what happened:

  • Why a trigger was validated? Or not?
  • The execution plan of the scene, and the different conditions validated / or not

After that it will be out of this PR.