I feel that my Gladys instance is a bit less responsive lately. The graphs take 10 seconds to load the first time, when I open my door in the evening, the light can take several seconds to turn on, etc.
How to investigate on the server side to rule out gladys and involve zigbee2mqtt?
You should see the running processes with their CPU and RAM usage.
Check that there is no inconsistency on this side (a lack of RAM can cause cascading issues), and look at the processes that are the most CPU-intensive.
Another useful command:
docker stats
Displays the metrics of each container.
DB Filling
I think in the past you already had an issue with a very verbose Zigbee2mqtt sensor filling the DB? You can inspect the DB as the last time (I think I gave you a SQL command).
I have the same problem as you, lmilcent, yet I don’t have zigbee2mqtt yet, but I do have the mosquitto broker and Node red installed on the same Rpi. I reinstalled everything twice, at first it works fine and gradually it slows down and sometimes Gladys reacts quickly.
Pierre Gilles
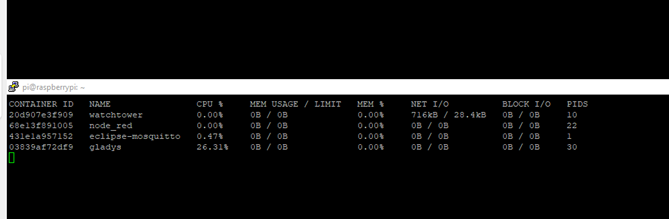
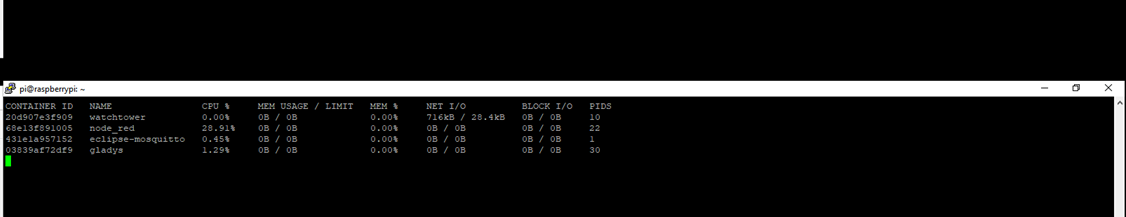
I ran your « htop » command (and as I’m lucky enough to have two RPIs, I compare) and on the one that’s slow I noticed that the Swp was significant (I don’t know how to interpret it) Mem[|||||||||||||||||||||||||||||||||||||||||||||||||||||||||||306M/923M] Swp[|||||||||||||||||||||||||||||||||||||||||||||||||||||||100.0M/100.0M]
On the other one which only has gladys configured, but without any device or anything else, I have this:
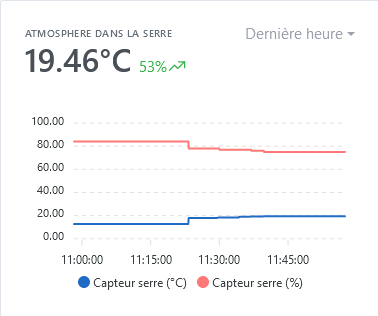
It varies, but there is a moment when I lose all the values. It’s recurring and in this state I can no longer control my devices (is it the access to the SD card?).
I hope you can read this
Regarding resources used, this was the first thing I checked. All seems good so far, except when I open the dashboard, which causes a spike in resources (logically). And of course, when I do a recorded test, it works perfectly!
To be continued, I’ll keep an eye on it. For now, my DB is at 3.5GB.
@Psoy Indeed, there’s clearly a resource issue on your end. I think that at certain points in your Pi’s lifecycle, you must have RAM spikes (to see when: it could be when Watchtower does the update? When Gladys does the background data aggregation? On the Node-RED side?), and it swaps heavily, which is very slow on an SD card.
Otherwise, your docker stats is really weird. SD card corruption cannot be ruled out either, which could explain these somewhat broken displays.
Maybe try restarting your Pi first? Otherwise, I would really advise you to switch to an SSD
I sometimes get this on remote machines, it’s not what I would worry about on my side.
Restarting may solve the problem, you should also check that Node Red is not consuming too much. Is it still at 30% CPU?
I almost crashed my raspberry pi because of a poorly made Node Red program
I have restarted the Pi several times and the issue persists. As for the SSD, I have been trying to install it for two weeks. I tried the tutorial by GBoulvin (now I have managed to partition everything. The operation went well all the way through, but when I restart the Pi without the SD card, the Pi does not start and the SSD LED does not even blink). Of course, I tried your tutorial and it did not work either. It does not restart. When I put the SD card back in, the RPI boots fine, the SSD blinks a bit. But I don’t know what it boots from, the SD or the SSD.
I think you should watch @pierre-gilles’ tutorial, he explains well how to display the result of an operation with the « debug » object, so possibly if there is a loop somewhere
Integrating Node-RED with Gladys Assistant in MQTT
Be careful because I ordered an SSD but it wasn’t recognized on the Pi and it wouldn’t start at boot.
Does your SSD have a button? That could be the issue if it does.
Bingo, I just reinstalled the SSD, but using a 250GB hard drive and it works.
Thanks Tlse-vins, for your help, I have the same issue as you, the SSD does not boot, yet it behaves normally on a PC, and it was taking ext4 partitions well, I don’t understand. Well, I can move on to something else.
I don’t have an on/off button, but when I used Pierre Gilles’ tutorial, it worked right away, whereas with the SSD (it’s an SP A55 128G, right?), it never started