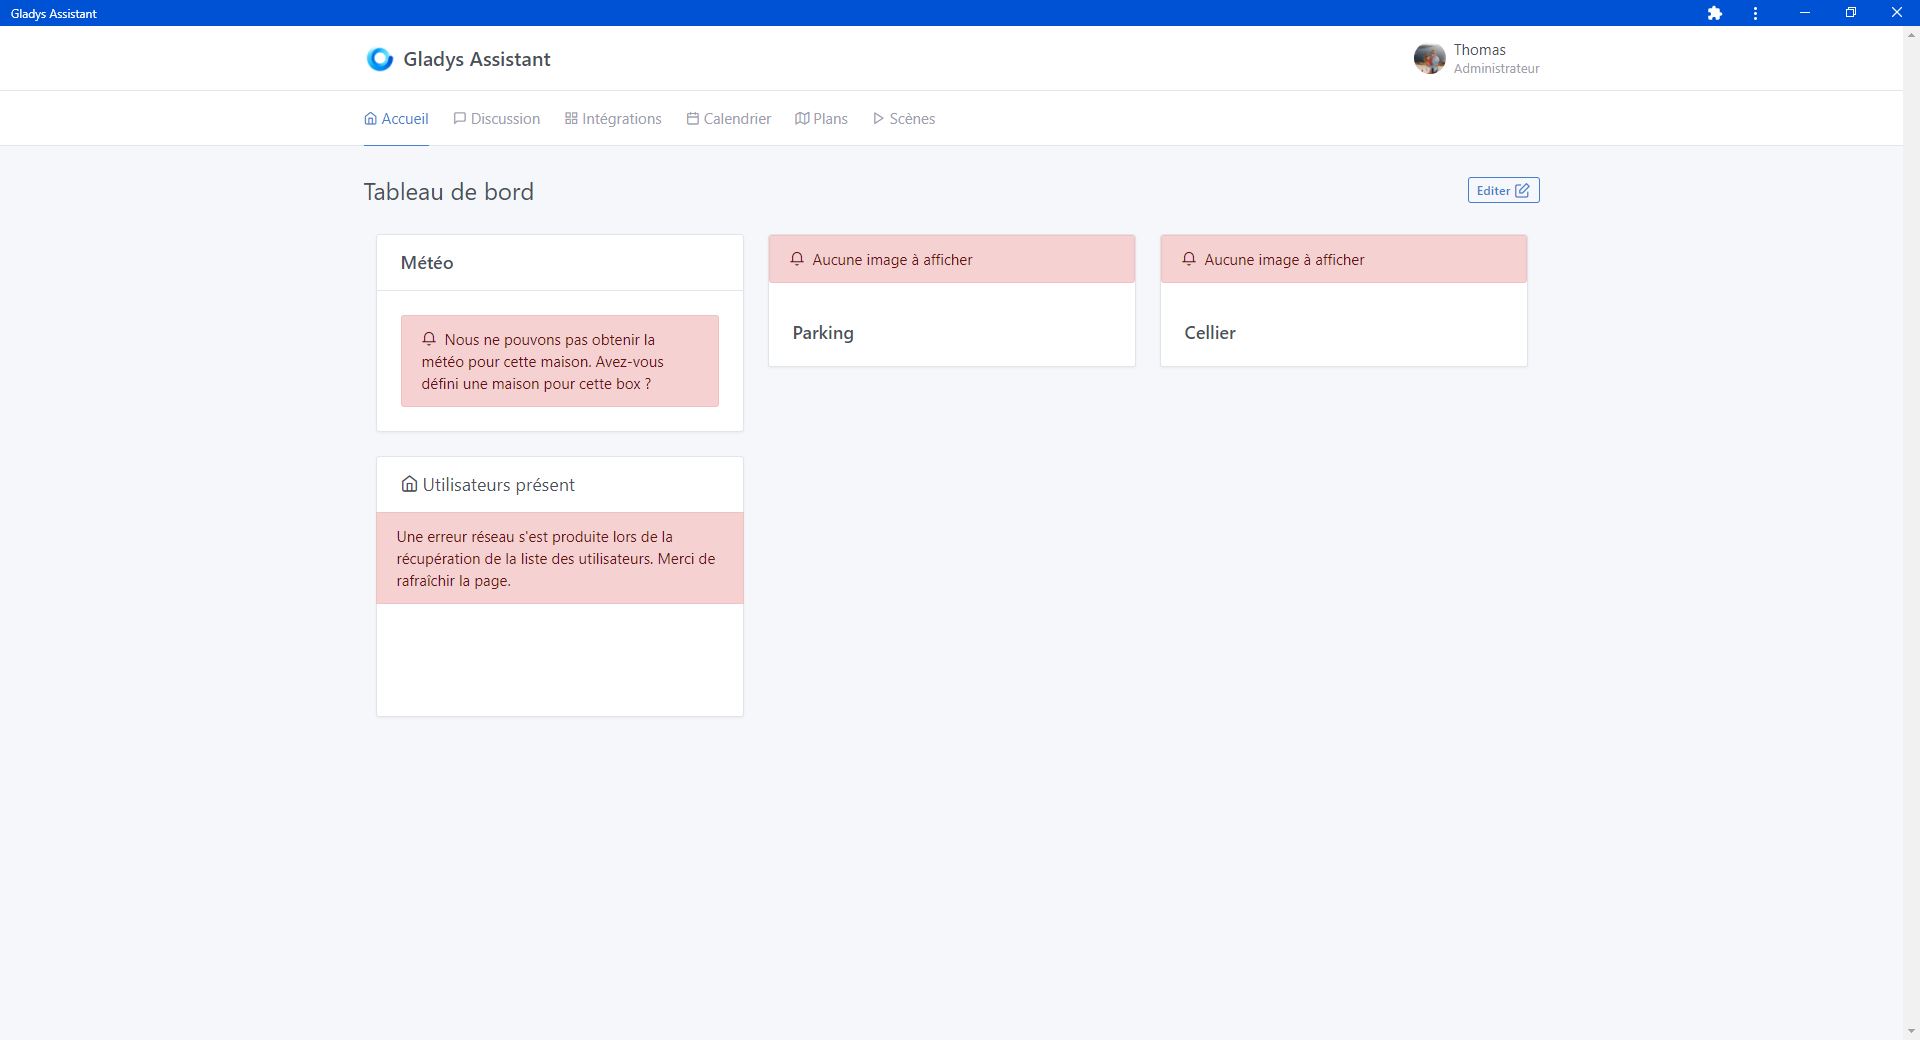
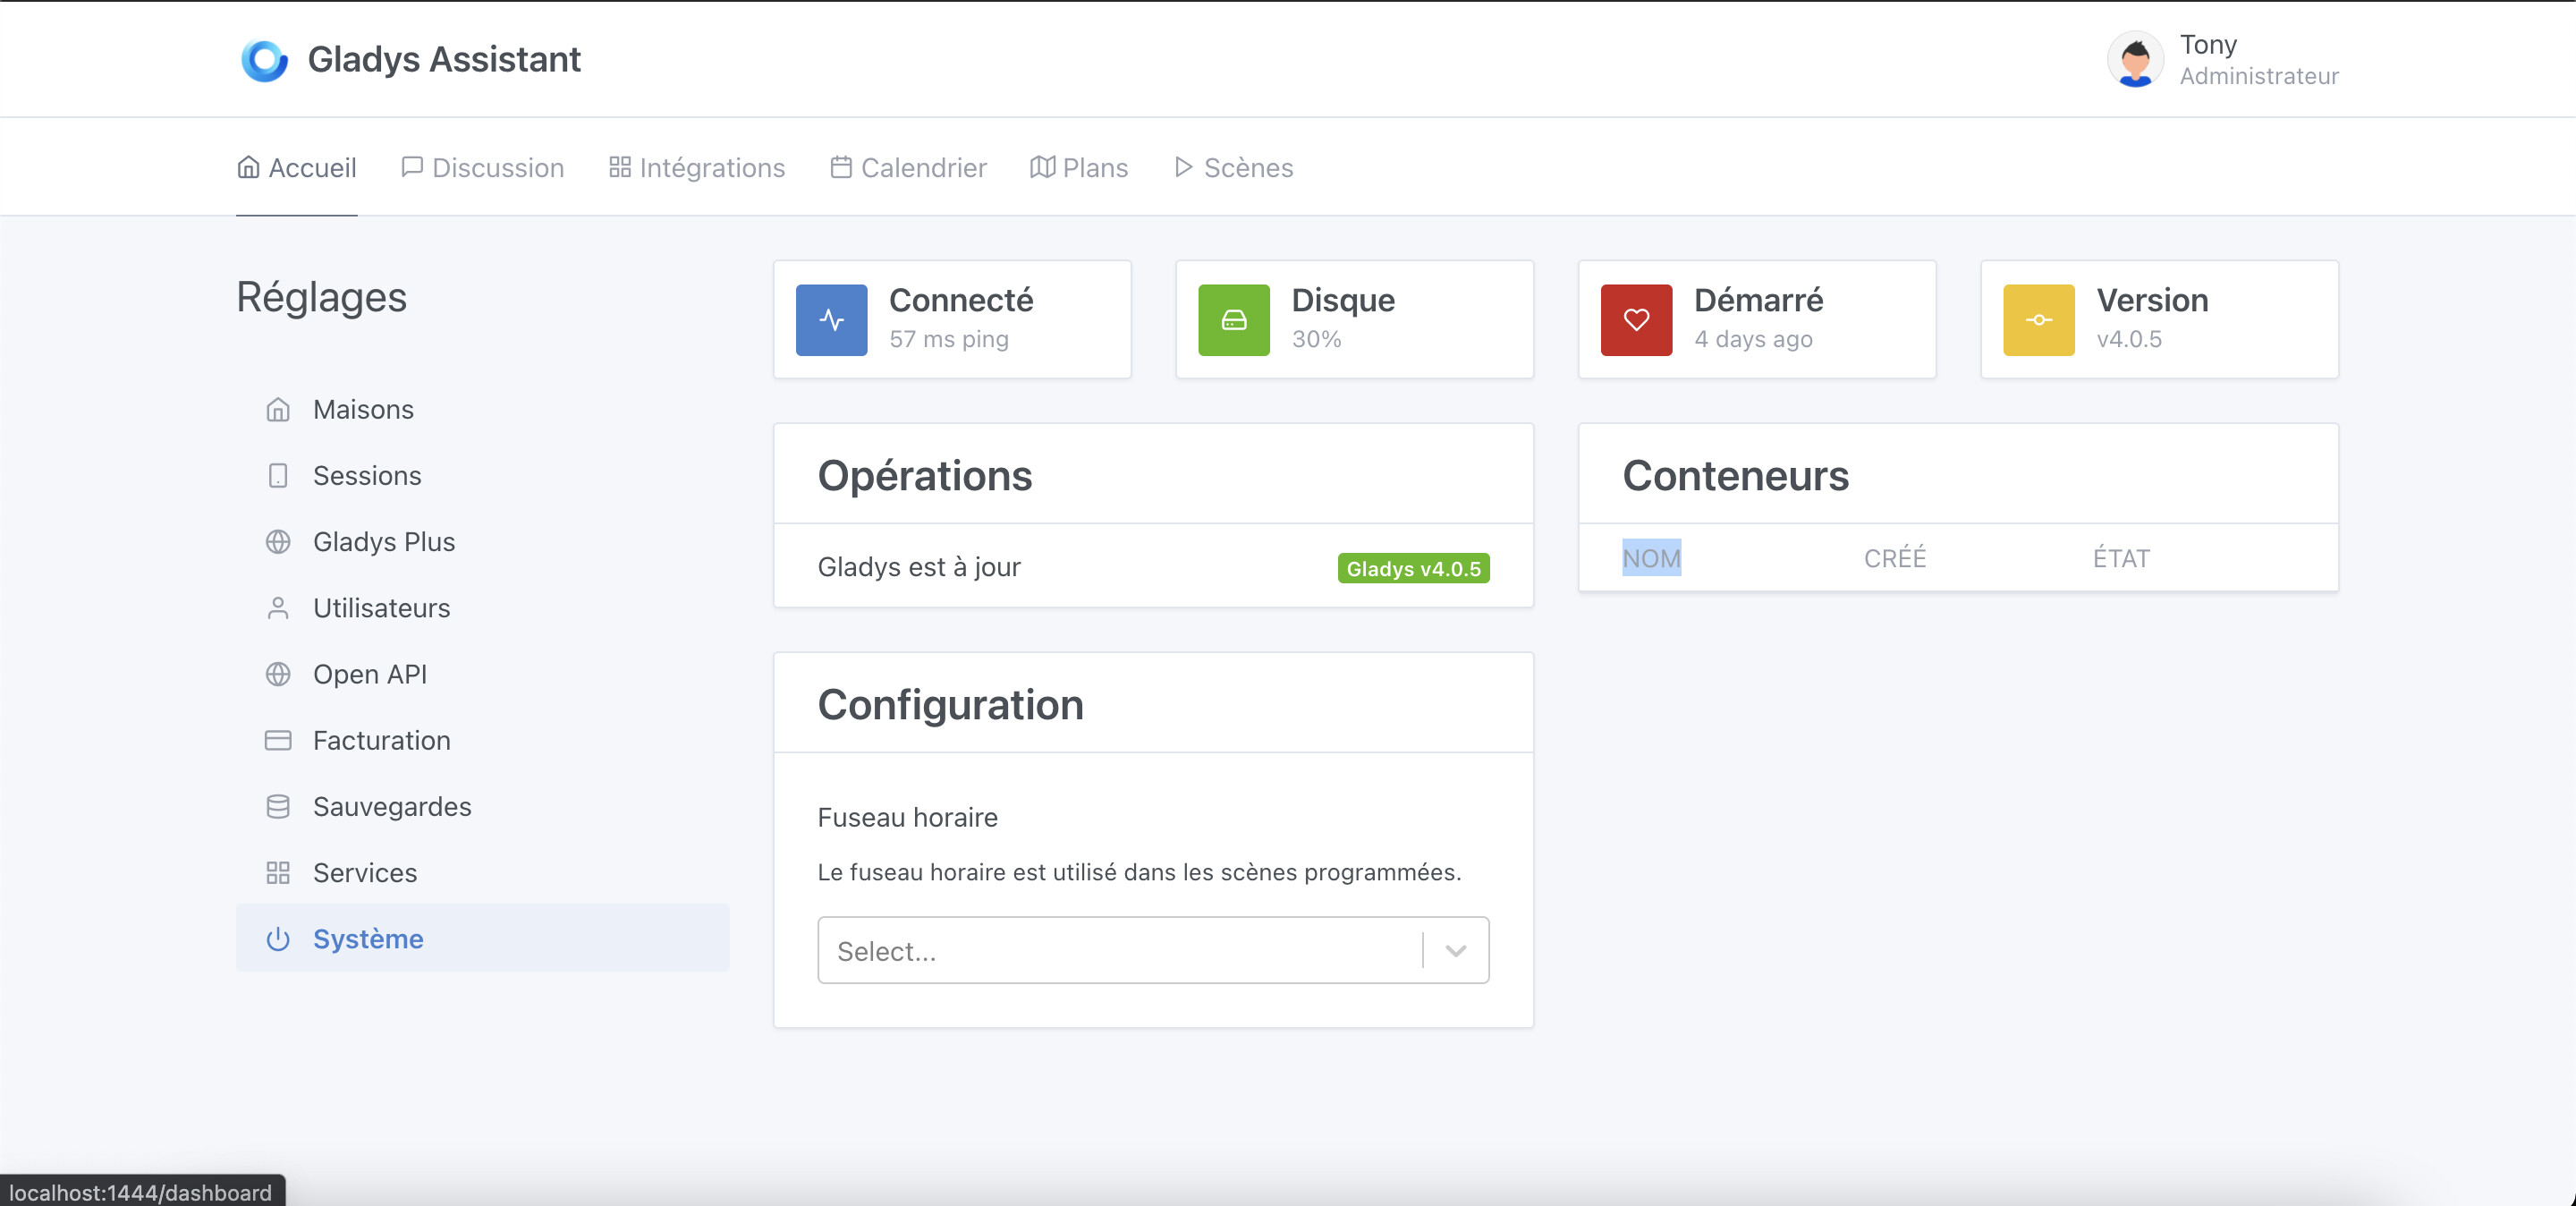
I have a display issue on the dashboard below that occurs regularly when I go through Gladys Plus. I first thought this happened when the Raspberry did not reboot for several weeks. I therefore scheduled a weekly reboot but it quickly came back. My other hypothesis would be the slowness of my internet connection. Would other users have this problem?
The two boxes on the right are supposed to display my cameras. The image eventually arrives a few dozen seconds later but the error message remains present.
Hello @Mastho, that’s strange! Indeed, it might be an internet connection issue, but not necessarily.
To better understand your problem:
Which Raspberry Pi do you have? Connected to a high-performance micro-SD (or not?)
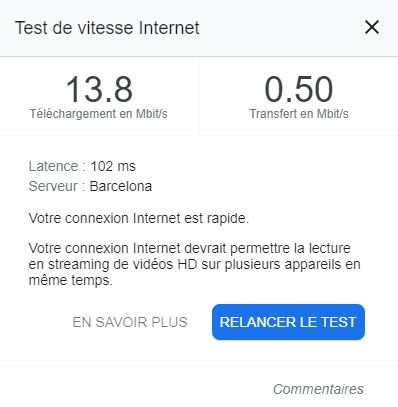
Could you post a speed test here (on the Raspberry Pi at your place AND on the machine where you use Gladys Plus)?
How many cameras do you have on your installation? Do you feel like your local Pi is « under pressure » or is it not too busy? What refresh rate have you set for the cameras?
We’ll debug this together until we figure it out If you’re available, we can also call directly to see it live together.
I have a 3B+ that I bought almost 2 years ago with a 24 Mb/s micro-SD.
I don’t think it’s a performance issue because locally, the display is instantaneous for the 4 boxes I currently use on the dashboard. I only have these two cameras with a refresh every minute.
Via Gladys Plus, I have the same problem whether I’m at home or on 4G from my phone. In the Gladys settings, I have a latency of 66 ms locally and 1500 ms via Gladys Plus.
I should have a time slot on Saturday or Sunday if you’re available too.
Below is the speedtest. For the internet box, I have 16 Mbit/s down for 900 kbit/s up.
Ouch, are you on ADSL for your internet box? With which operator?
You do have a fairly low upload speed, and a really high ping, which explains the slowness you’re experiencing, but that doesn’t explain everything. Normally, it should just be slower.
Available this weekend whenever you want to look at it together.
267ms is excellent, you have nothing to blame yourself for
Actually, the word « ping » might be misused here, it’s not just network time here, but processing time in this calculation.
What is calculated is the time between:
→ The frontend sends « ping » to the Gladys Plus server
→ Gladys Plus sends « ping » to your Gladys instance
→ Your Gladys instance responds « pong » to the Gladys Plus server
→ Gladys Plus responds « pong » to the browser
So in fact, the « ping » is more like a « ping x4 » here, knowing that at each step there can be simple delays (your Gladys instance is requested by sensors permanently, so it may not respond pong directly, etc..).
267ms for you is just excellent for all that
You have 60ms because the ping is just a « ping » to your machine on the local network.
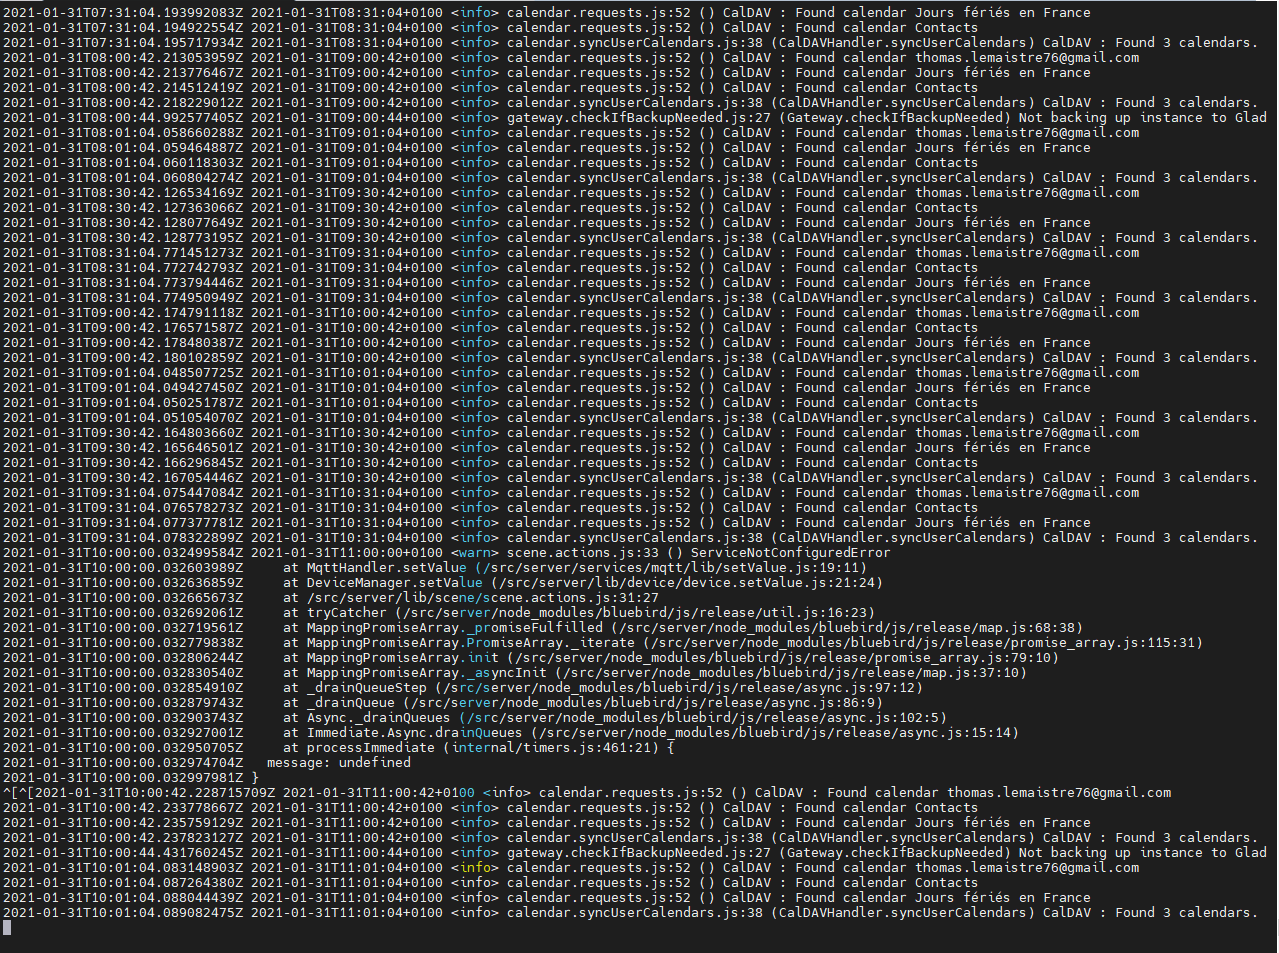
We just had a call with @Mastho to investigate, and it’s not a network issue, but rather a local problem on his Gladys instance This is good news, as there’s nothing we can do about network issues, but a local problem can be resolved!
What’s interesting is that after restarting Gladys, the problem was gone, and Gladys Plus was working fine.
The fact that we’re using a transaction can create a deadlock, and I wonder if that’s what’s happening here.
In my opinion, the transaction doesn’t necessarily make sense here, and we can remove it. Especially when Gladys is used on micro-SDs with rather average read/write performance, a transaction is heavy and queues all other writes (SQLite in WAL mode only supports one write at a time).
Ok, I tested it locally, and indeed I found issues with the transactions we use. Clearly, there were bugs as soon as there was any concurrency. I wonder if the version of Sequelize we are using also has problems with this. We will need to consider updating Sequelize…
I made a PR that removes these faulty transactions and adds concurrency tests, and now it works much better:
@damalgos following our call this morning, I investigated, and you were right 600ms is not normal
Already on the Gladys gateway server side, I made some optimizations, but they do not significantly change the situation.
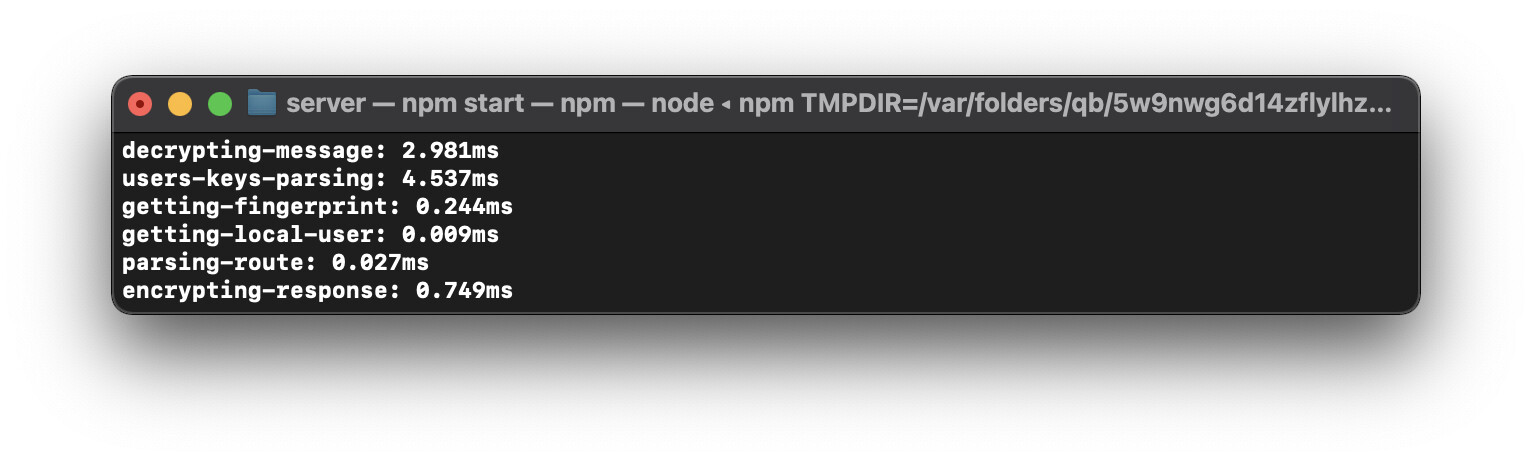
The real problem comes from this famous « getUserById » local to Gladys, which makes a DB call for each request, and which can cause DB blockages. I noticed blockages of 700ms locally at my place, despite the fact that I am on a Mac with a future SSD…
This DB query is not necessary, by replacing it with a RAM call (thanks to the « stateManager »), I drop to 55ms, it’s much better, and it corresponds more to what we expect from a request.