Hi,
Has anyone else had the same problem as me?
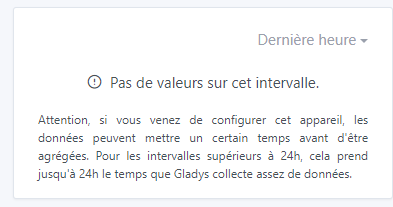
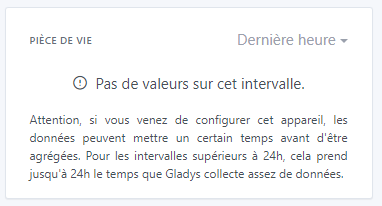
When I switch a chart from 24h to 1h, I have no data. It’s as if the sensor hadn’t returned anything, which is not the case. The 24-hour view shows data from a few minutes ago.
No tasks showing errors in the settings, no error logs in the browser or container console.
Any ideas to understand what’s going on?
Thanks 
So I got this when the latest data were all identical over the past hour
Like a temperature sensor that hasn’t changed for 1 hour
This confirms that it’s a recurring bug.
hello, same for me — for quite some time I thought, for example, that for a door sensor which includes a temperature sensor, that temperature is only sent when there is a trigger.
Some sensors may do that to conserve as much energy as possible.
However, I see many people on the « zigbee2mqtt » project reporting that their devices take a long time to respond or to send data.
I had that happen too; I rebooted hoping to temporarily fix it. The placement of the USB dongle might also play a role.
See if it’s the same in your case or not at all.
Hi @lmilcent,
Do you have more information? I’ve never had the bug. I have quite a few sensors on my dashboard, in « Last hour » and « last 24h », I tried switching between the two and everything works ^^
What kind of sensors are they?
That’s indeed my problem, they’re the same sensors as my previous setup that worked well.
- Aqara temperature
- Sonoff temperature
- Plugs from different brands
I don’t see any errors in the browser console, or the container, nor in the gladys task statuses..
What I’m trying to understand is whether it’s a display issue (the sensor does return a value, but the request doesn’t show the value), or whether it’s a device problem that’s not sending anything / Zigbee2mqtt that’s acting up
What do you think?
I’m 100% certain there must be values. I have smart plugs, thermostats that I poll to retrieve data every 5 seconds, etc.
Do you pull every 5 seconds? ^^ What kind of device is that?
I really don’t recommend doing that
Yes, it’s annoying. These are thermostats that have firmware with a bug, and to update it you have to buy the vendor gateway for €100, which I wouldn’t use afterward..
And since the heating period happens every 15 sec, I have to get the values very regularly..
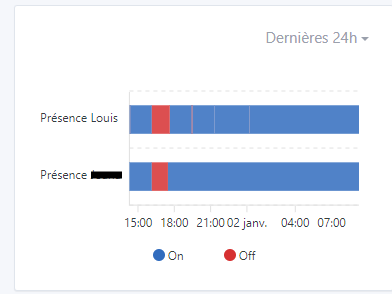
For the graphs, here is an example. It’s an MQTT device that I created, which is set to 0 when I’m away and to 1 when I’m here.
As soon as I switch it to « 1 hour » mode, it doesn’t display anything anymore, even though it must necessarily be either zero or one.
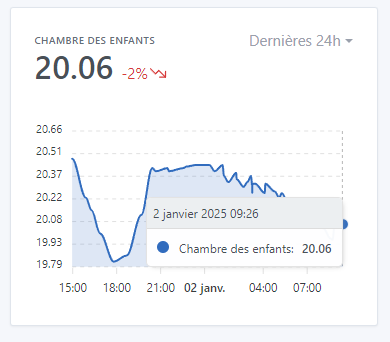
What time was the last change on the 24h chart?
I don’t see any change in the last hour…
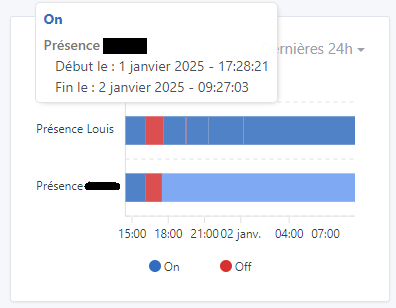
On the chart in 24-hour mode, you can clearly see a value at 9:27 (EST Time).
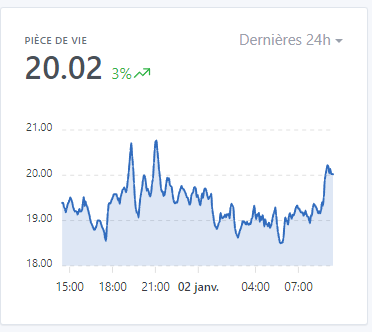
But I have other examples:
9:27 is the current time, I think, not a sensor value (I see that your message was posted at 9:29 EST)
Is there a value after 8:27 on this chart?
Yes, I can confirm that I have plenty of charts with recent data.
It’s not the same chart!
I’d like an example of a chart:
Yes, it’s not the same chart, sorry for the lack of consistency, I was just being lazy.
In this case, no chart works in "1
Ok interesting, I just wanted to be sure
Are you on the latest version of Gladys (v4.50.2) and currently accessing it locally?
Are you starting from a fresh installation or is it your France installation that you migrated which came from an SQLite DB? Just to know whether it’s DuckDB in the process of migrating or not