wtuxii
November 29, 2023, 9:15pm
1
Hello,
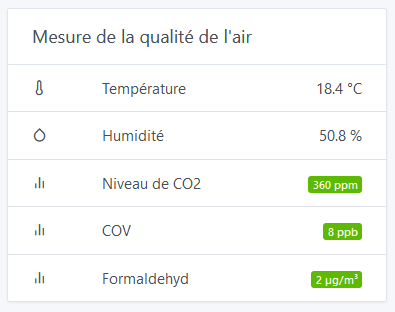
The IKEA Vindstyrka sensor can measure humidity, temperature, PM2.5 as well as a VOC index.
This last measurement is reported by the « Sensirion VOC index » in zigbee2mqtt:
This measurement is not supported by Gladys. Is it possible to integrate it into Gladys?
Thanks
Hello @wtuxii ,
I think we should focus on integrating this sensor, but the « VOC » (or « COV » in French) is already supported.
I can’t remember who had worked on that, @pierre-gilles or @cicoub13 ?
Are VOC and voc_index the same?
We already handle VOC in Zigbee2mqtt, but I find it surprising that IKEA created a different variable — is it really the same unit?
See:
Good question, I hadn’t thought it might be different, my bad .
The brand explains:
The VOC Index describes the current VOC status in a room relative to the sensor’s
wtuxii
November 30, 2023, 8:50am
5
Indeed, they are two different types.
The VOC returns an absolute value while the voc_index is actually more of a rate of change.
For UI integration, we could represent its value with arrows like the sensor’s display:
Exposing the numeric
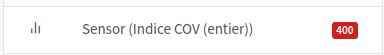
We can do it with colors in Gladys (red => not good, etc…)
What would be the rule for this sensor? If someone does the development here, we should do the legwork in advance
wtuxii
November 30, 2023, 11:14am
7
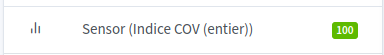
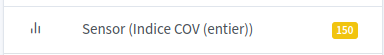
We could base it on the documentation:
0 - 150 : green
Ok @wtuxii , we prioritize features based on votes!
@wtuxii ,
Are you ready to install a test image and test it live?
Will_71
December 2, 2023, 11:38pm
10
the image for testingwillde71/gladys-test:voc_index
@pierre-gilles , the PR
master ← William-De71:zigbee2mqtt-voc-index
ouvert 10:33PM - 02 Dec 23 UTC
### Pull Request check-list
To ensure your Pull Request can be accepted as fa… st as possible, make sure to review and check all of these items:
- [ ] If your changes affects code, did your write the tests?
- [ ] Are tests passing? (`npm test` on both front/server)
- [ ] Is the linter passing? (`npm run eslint` on both front/server)
- [ ] Did you run prettier? (`npm run prettier` on both front/server)
- [ ] If you are adding a new features/services, did you run integration comparator? (`npm run compare-translations` on front)
- [ ] Did you test this pull request in real life? With real devices? If this development is a big feature or a new service, we recommend that you provide a Docker image to the community ([french forum](https://community.gladysassistant.com/)/[english forum](https://en-community.gladysassistant.com/)) for testing before merging.
- [ ] If your changes modify the API (REST or Node.js), did you modify the API documentation? (Documentation is based on comments in code)
- [ ] If you are adding a new features/services which needs explanation, did you modify the user documentation? See [the GitHub repo](https://github.com/GladysAssistant/v4-website) and the [website](https://gladysassistant.com).
- [ ] Did you add fake requests data for the demo mode (`front/src/config/demo.js`) so that the demo website is working without a backend? (if needed) See [https://demo.gladysassistant.com](https://demo.gladysassistant.com).
NOTE: these things are not required to open a PR and can be done afterwards / while the PR is open.
### Description of change
add voc_index expose in zigbee2mqtt integration

wtuxii
December 3, 2023, 10:32am
11
Perfect
Is it possible to change the color of the arrow in the chart?
same for PM2.5
Will_71
December 3, 2023, 10:59am
12
In the charts it’s a separate development. I don’t think these are the only data to invert.
There is a parameter in the Gladys front-end in the charts to indicate whether a data point is « positive » or « negative » to make the arrow red or green
If that’s not the case, tell me
Will_71
December 4, 2023, 8:33pm
14
Ok, I’ll take a look and get back to you
Edit: I found it!voc_index has no unit! No problem for the other data.
Ah! We’ll have to modify the code then ^^
Will_71
December 5, 2023, 9:54pm
16
or else create a unit type « no unit » without modifying the code in the charts.
We could maybe open a dedicated thread (and a PR) for modifying the data in the charts?DEVICE_FEATURE_UNITS.WATT_HOUR is inverted.
[quote="_Will_71, post:16,
Will_71
December 6, 2023, 8:51pm
19
Ok in that case you can already review this PR.
I’ll look into making another PR for the change in the charts.
Thanks for the PR @_Will_71 !
master ← William-De71:zigbee2mqtt-voc-index
ouvert 10:33PM - 02 Dec 23 UTC
### Pull Request check-list
To ensure your Pull Request can be accepted as fa… st as possible, make sure to review and check all of these items:
- [ ] If your changes affects code, did your write the tests?
- [ ] Are tests passing? (`npm test` on both front/server)
- [ ] Is the linter passing? (`npm run eslint` on both front/server)
- [ ] Did you run prettier? (`npm run prettier` on both front/server)
- [ ] If you are adding a new features/services, did you run integration comparator? (`npm run compare-translations` on front)
- [ ] Did you test this pull request in real life? With real devices? If this development is a big feature or a new service, we recommend that you provide a Docker image to the community ([french forum](https://community.gladysassistant.com/)/[english forum](https://en-community.gladysassistant.com/)) for testing before merging.
- [ ] If your changes modify the API (REST or Node.js), did you modify the API documentation? (Documentation is based on comments in code)
- [ ] If you are adding a new features/services which needs explanation, did you modify the user documentation? See [the GitHub repo](https://github.com/GladysAssistant/v4-website) and the [website](https://gladysassistant.com).
- [ ] Did you add fake requests data for the demo mode (`front/src/config/demo.js`) so that the demo website is working without a backend? (if needed) See [https://demo.gladysassistant.com](https://demo.gladysassistant.com).
NOTE: these things are not required to open a PR and can be done afterwards / while the PR is open.
### Description of change
add voc_index expose in zigbee2mqtt integration