I think I know where the bug comes from — it’s not a bug related to the Enedis integration per se, but to the way the aggregation of values linked to historical data works!
Would you mind sending me your database privately so I can reproduce the issue on my end?
I can’t promise I’ll have time to do it tonight.
I’ll take a look.
It would be nice to be able to retrieve the file directly via Gladys Plus. Wouldn’t that be possible?
Thanks @_Will_71 for your DB, that confirms what I thought. The Enedis integration works well, you have all the data on your local DB, however the aggregated data are not correct which is causing these display issues
I created a GitHub issue, I’ll keep you posted when it’s fixed
The file on the Gladys Plus side is encrypted with a key only present on the local instance, so in any case there will be a download to the local instance + a decryption; not sure that’s the best option
But a « Download my database » button in Gladys locale, why not (to see if it’s a recurring need)
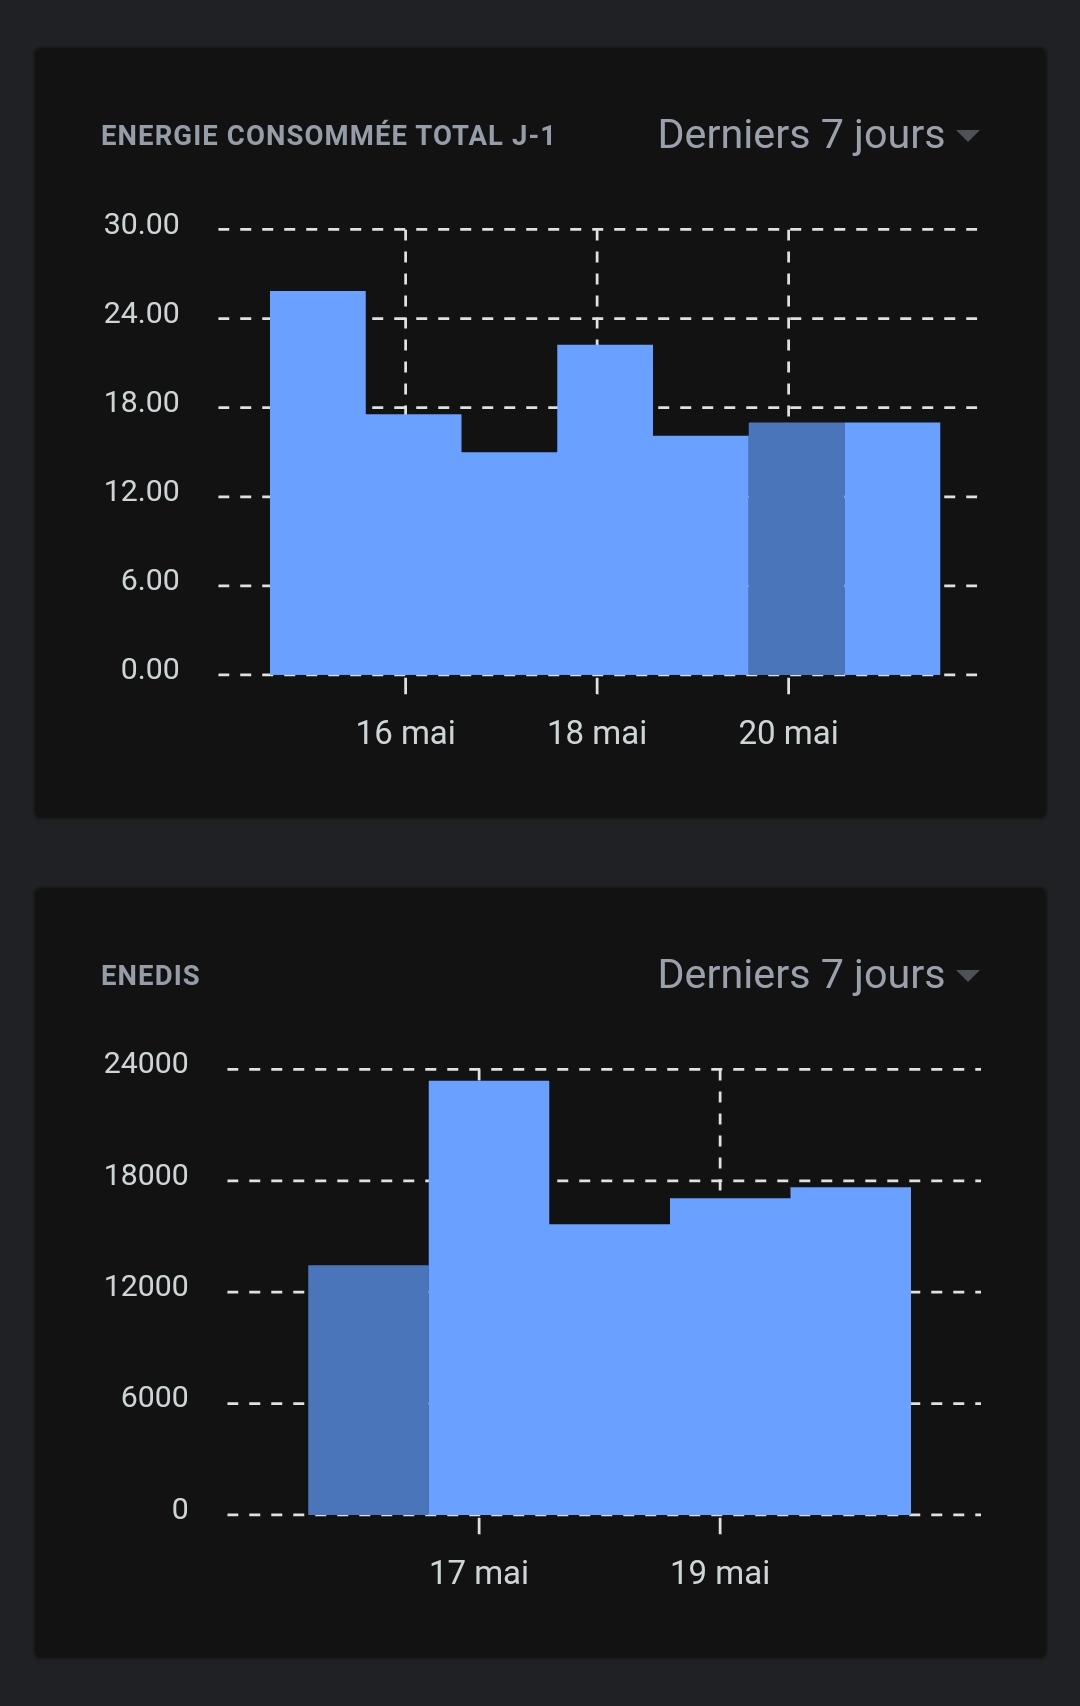
This may be confusing, but when this chart displays the last 7 days, it will fetch the last 7 24-hour periods.
So if you look at your chart on Sunday at 3:00 PM, it will fetch states up to the previous Sunday at 3:00 PM, which makes sense if you’re looking at a line chart with lots of sensor values.
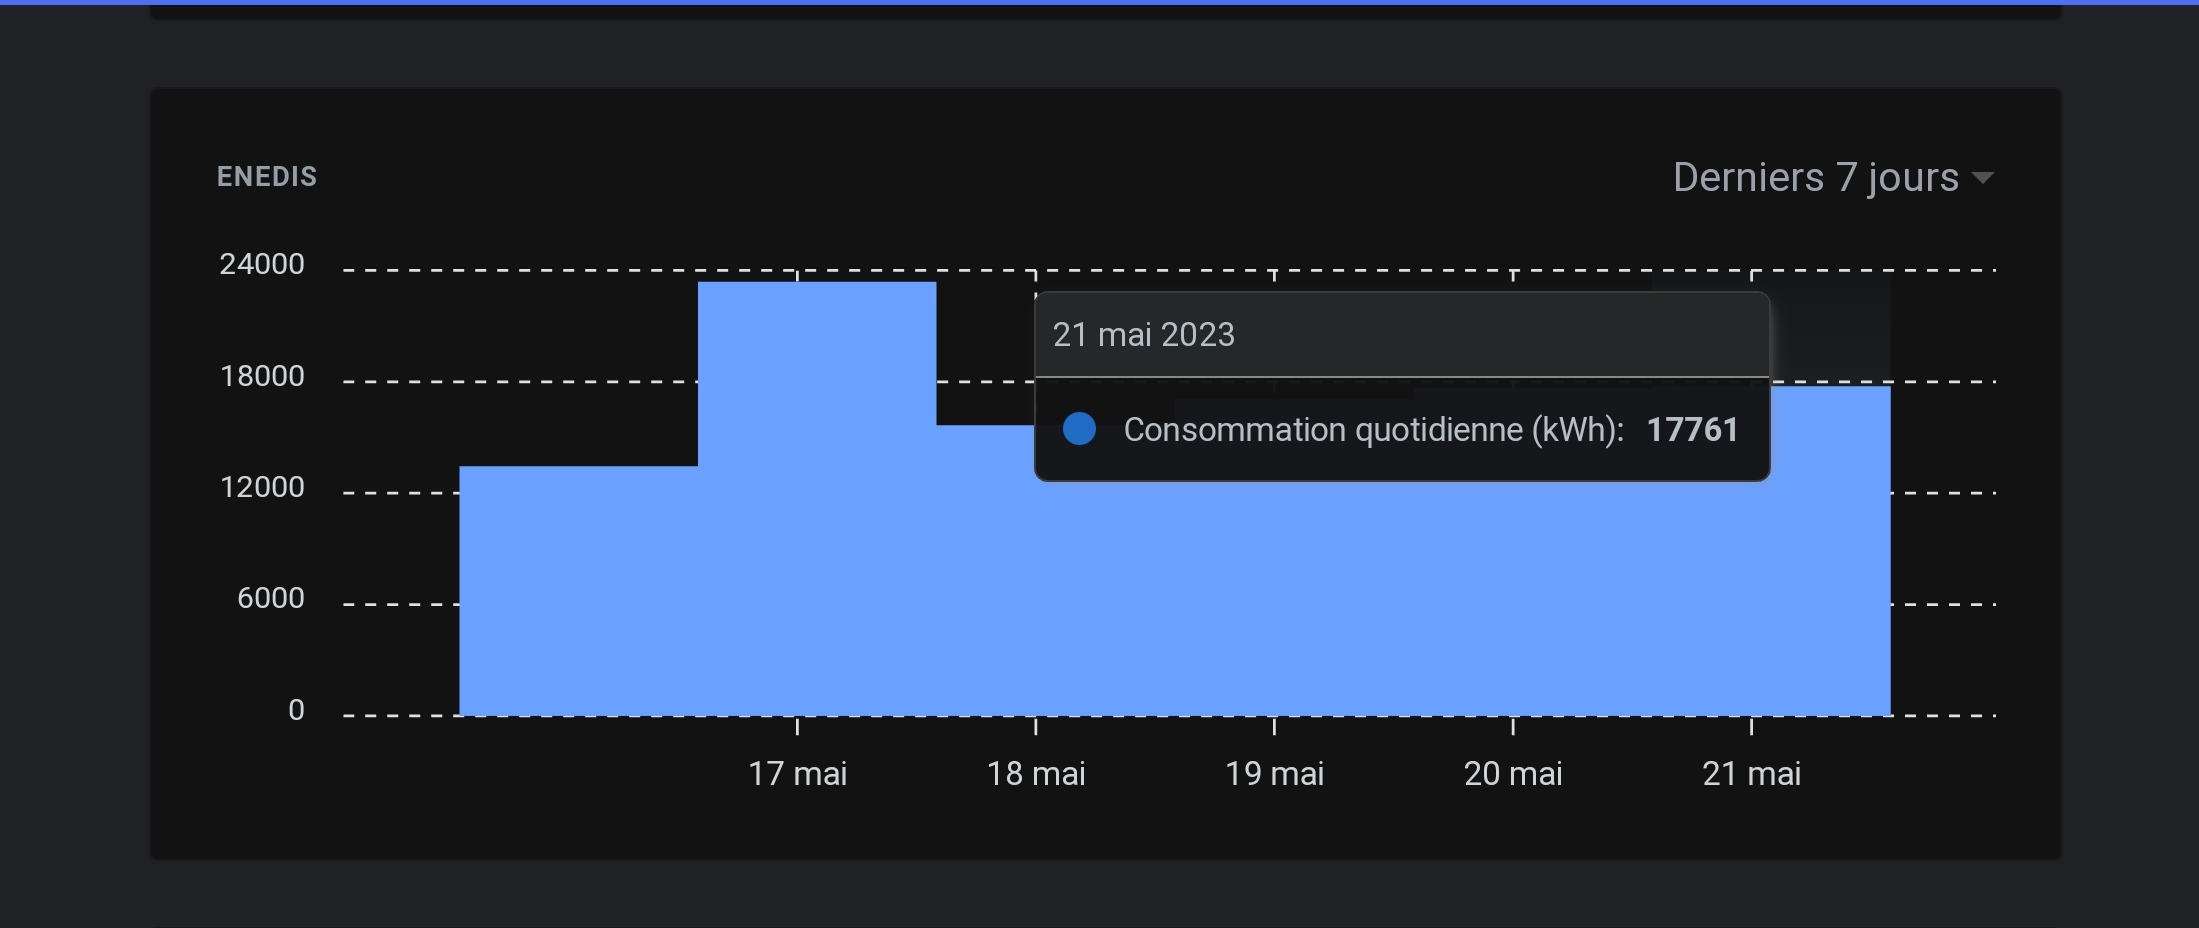
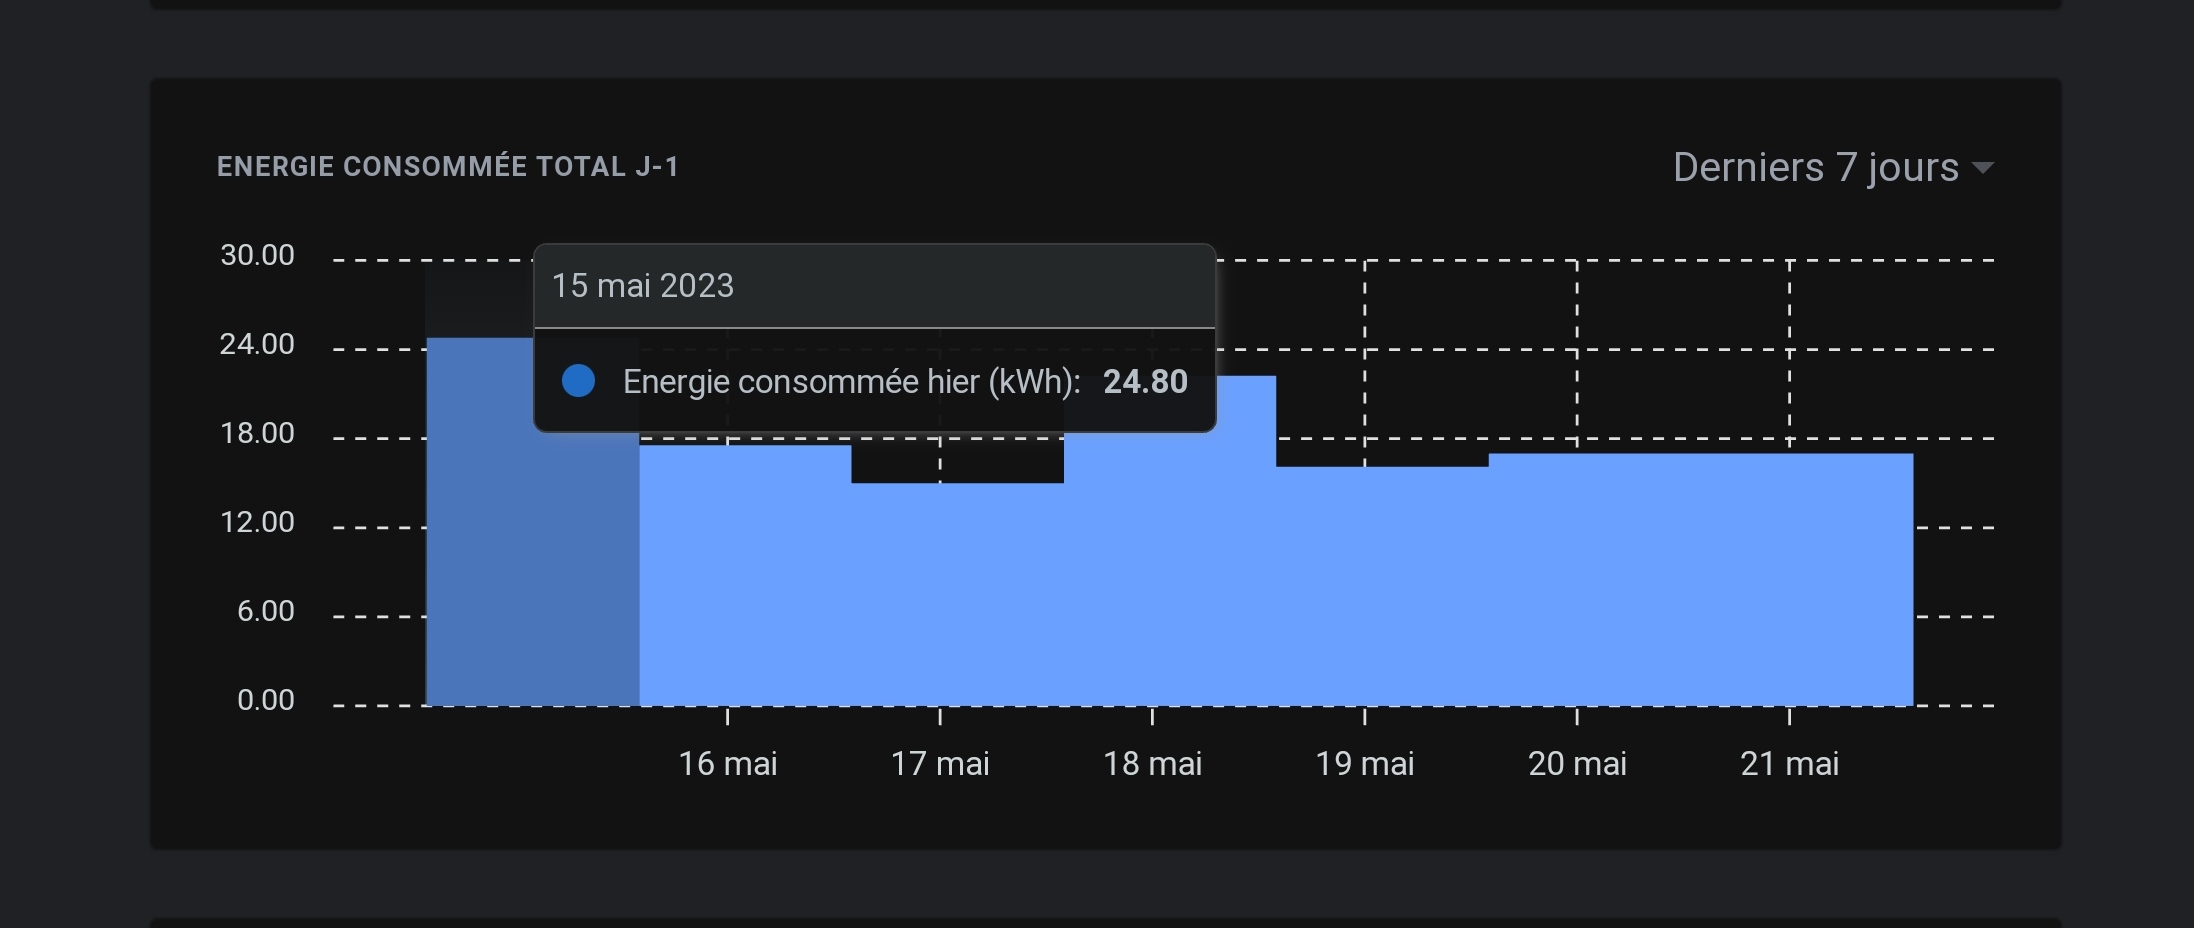
The Enedis case is special, because there is only one state per day (since it’s a daily consumption), an event which is inserted on the day’s date (with 00:00 for the time → midnight)
So if you check during the day, indeed it will only display 6 days because the state at midnight is too old for this view
Several options are possible:
Either we change for everyone so that « last 7 days » = « the last 7 days starting at midnight of the day 7 days ago »
Or we change only for a selected set of sensor types (of which Enedis will be part)
Otherwise, due to the unique nature of the Enedis integration, the next step of this development (if there is demand for it) was to develop a custom graphical display specifically for « electricity consumption »; I had made mockups on the subject: