Hello everyone!
I have lots of news for you today ![]()
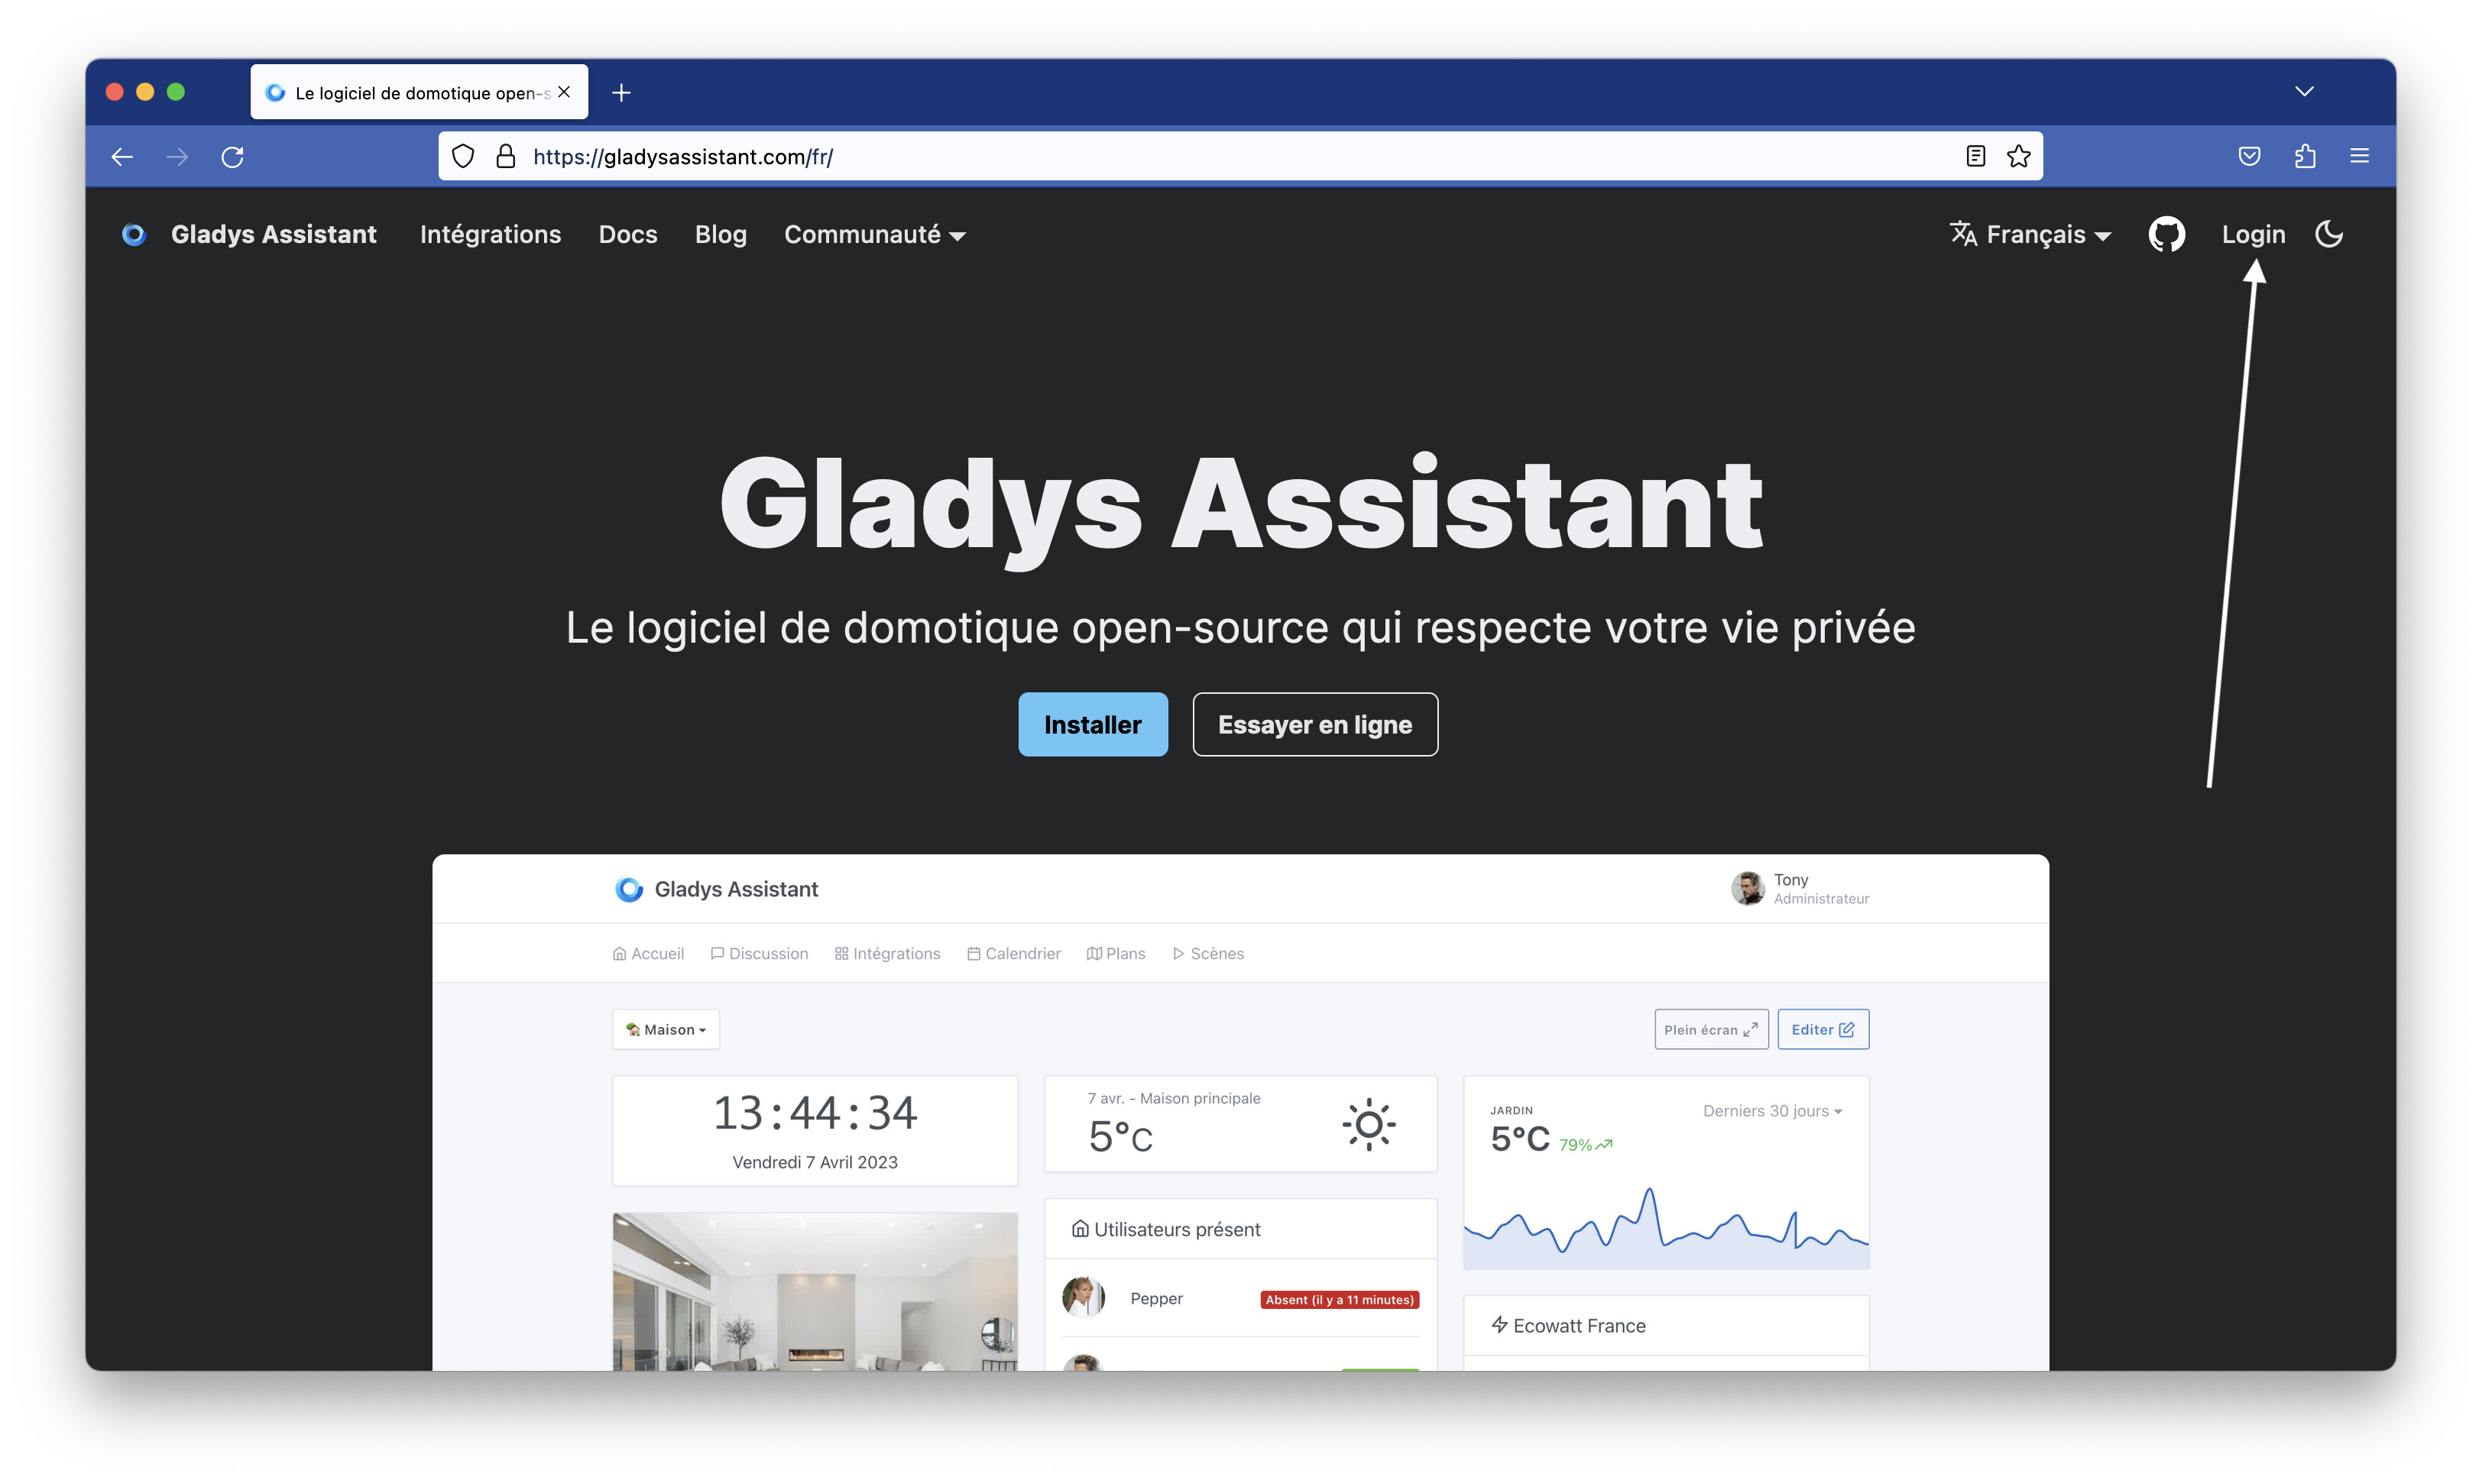
Homepage redesign
I wasn’t satisfied with the current homepage, and I’ve been working for a while on a complete redesign.
It’s done! ![]()
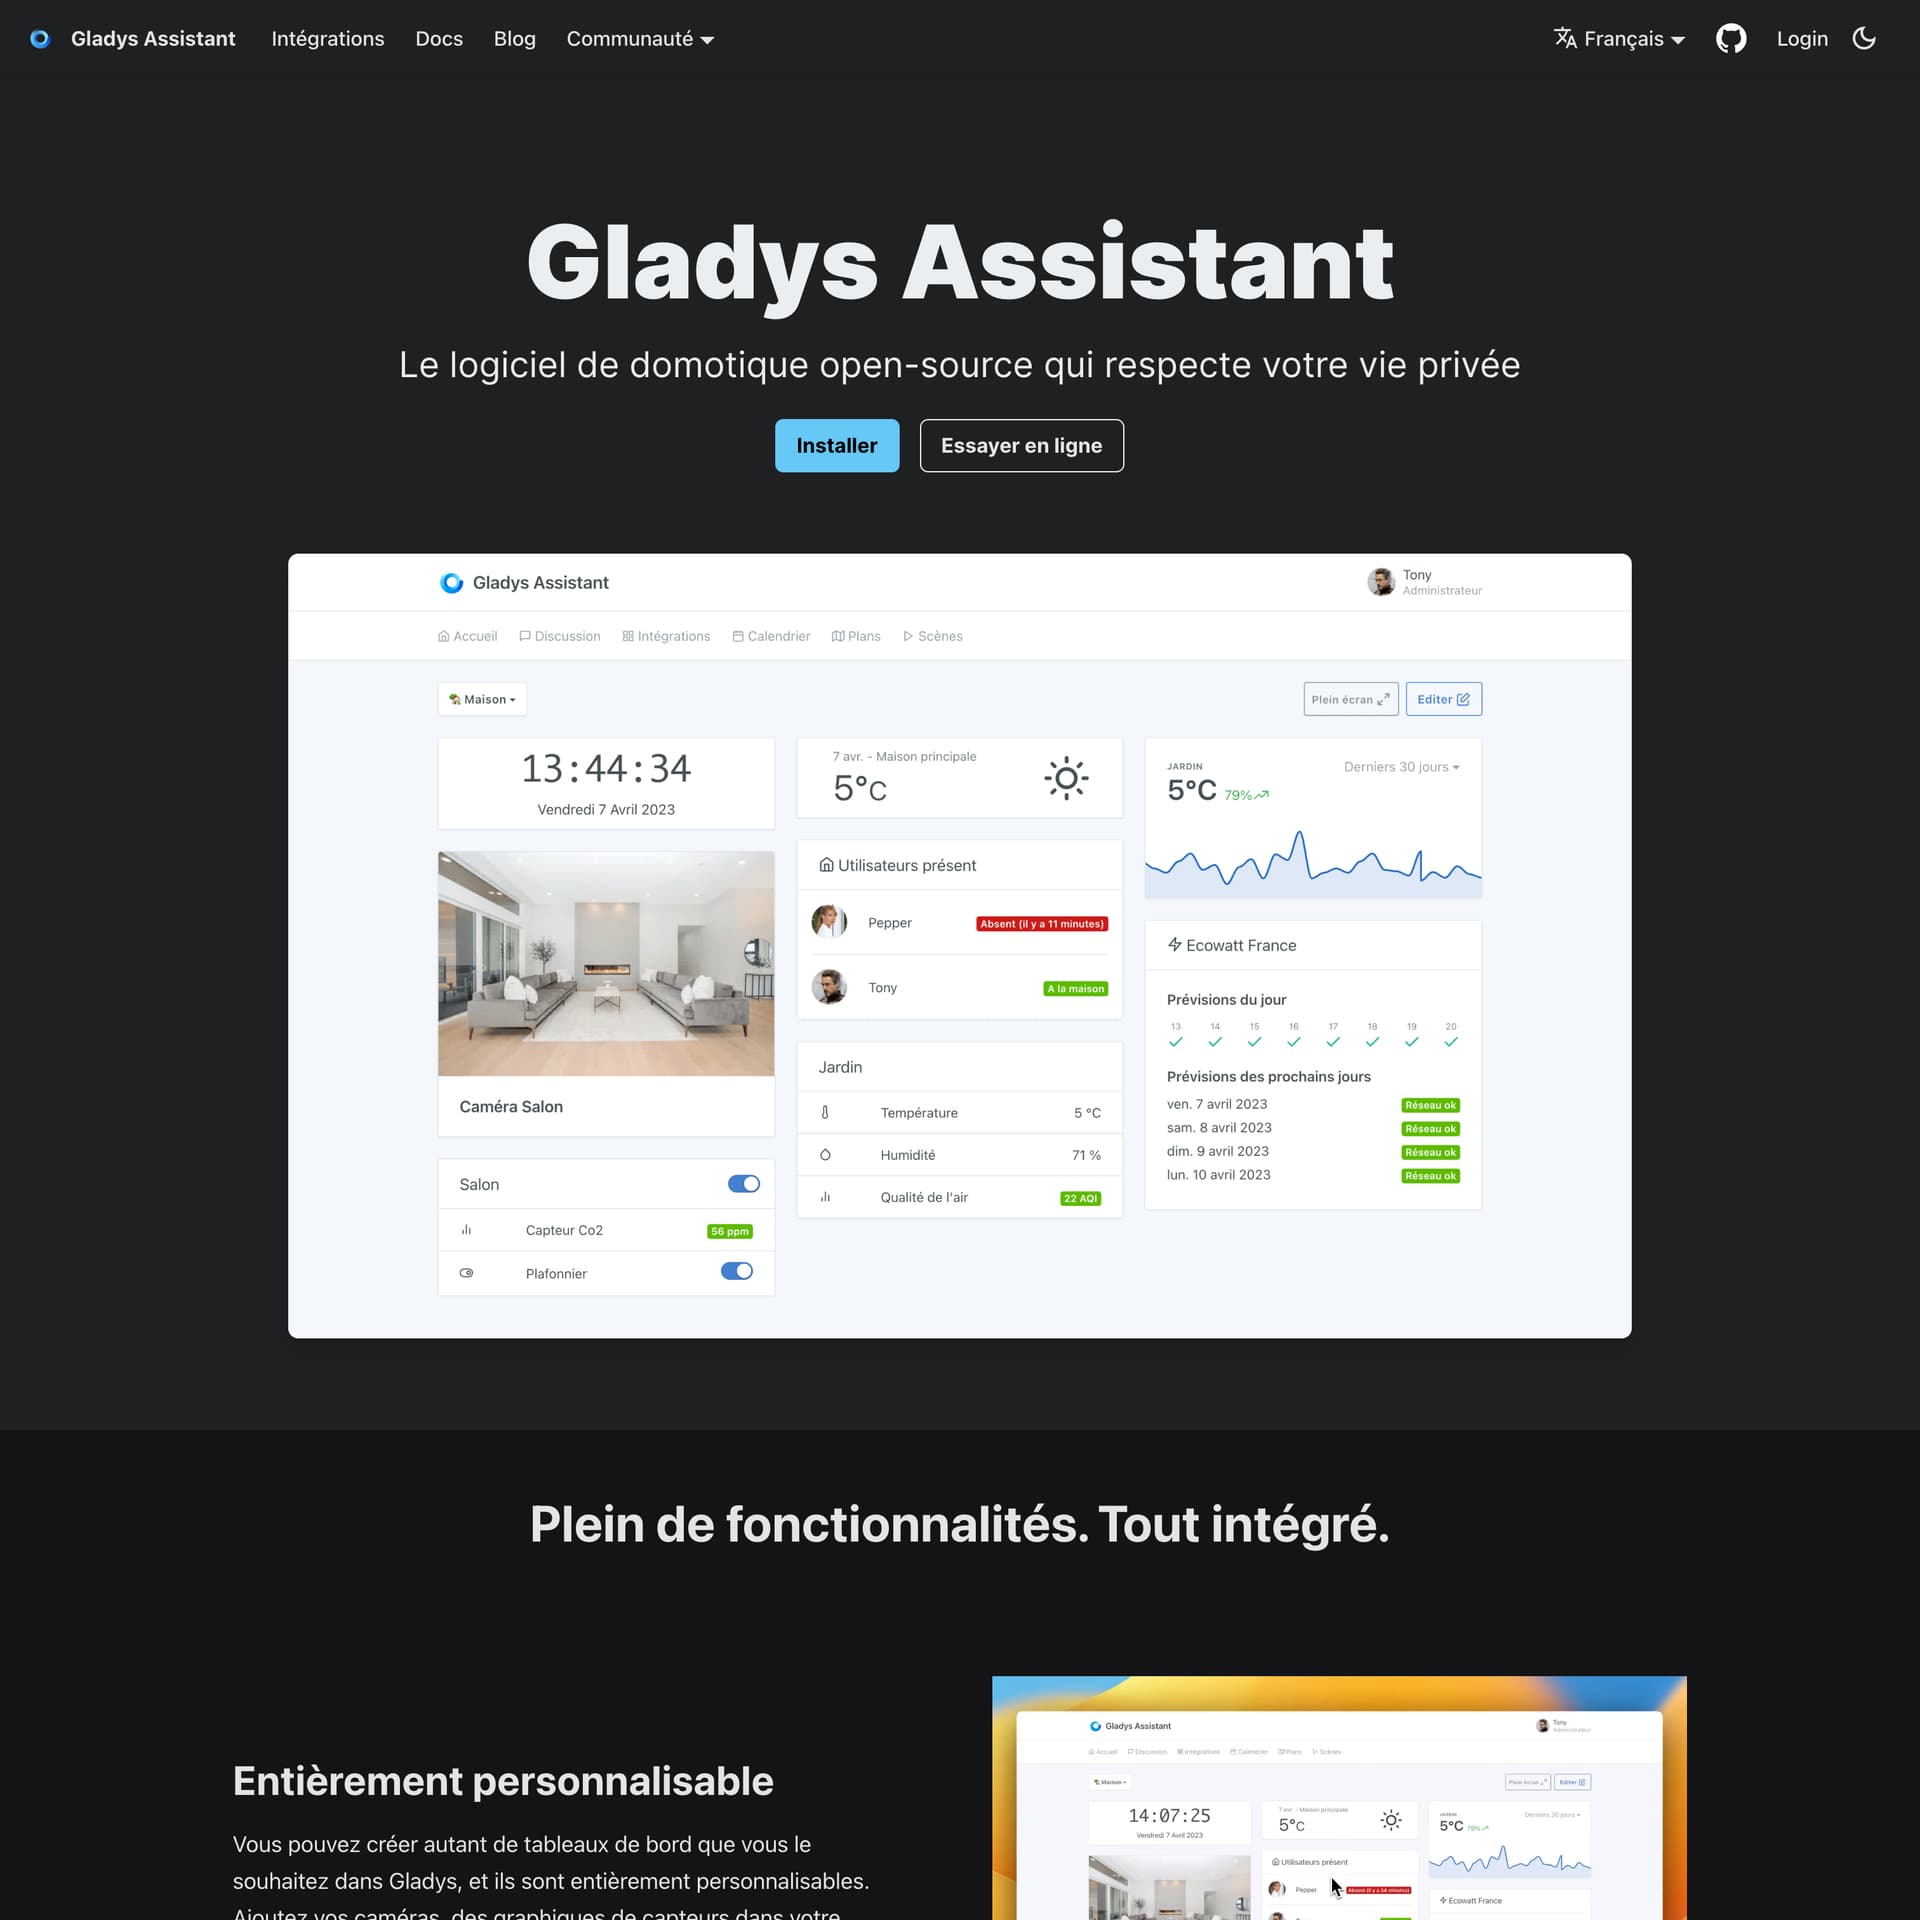
- The page is more comprehensive: I explain Gladys’ key features (with short videos), the project’s philosophy, and compatible integrations.
- The page is up to date: I updated the screenshots with Gladys’ new features (Charts, time display, Ecowatt integration, air quality sensors, etc…). The media on the page is available in French AND in English. That was a lot of work ^^
- The page is more spacious, with clearer spacing than before.
- The community aspect is highlighted with user testimonials at the bottom of the page. If you want to add your testimonial about Gladys, you can post it as a reply to this post and I’ll add it to the site

- I added an « FAQ » at the bottom of the page to answer various questions people often ask when arriving on Gladys. If you have ideas for questions/answers to add, feel free to share.
The updated site can be viewed here:
Thanks to @lmilcent @tiboys @guim31 @Tlse-vins and @jparbel for the testimonials ![]()
Gladys Assistant 4.20: Enedis integration in public beta!
After 2 weeks of testing in private alpha, I’m happy to move Enedis to public beta ![]()
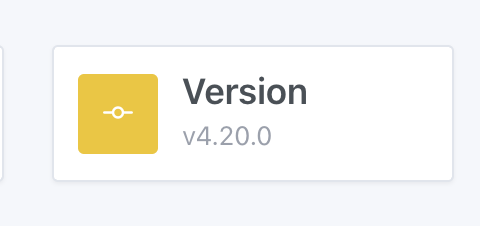
If you want to test this Enedis integration, make sure your Gladys installation is on « v4.20.0 »:
This first beta focuses on one thing, and tries to do it well: synchronization with Enedis.
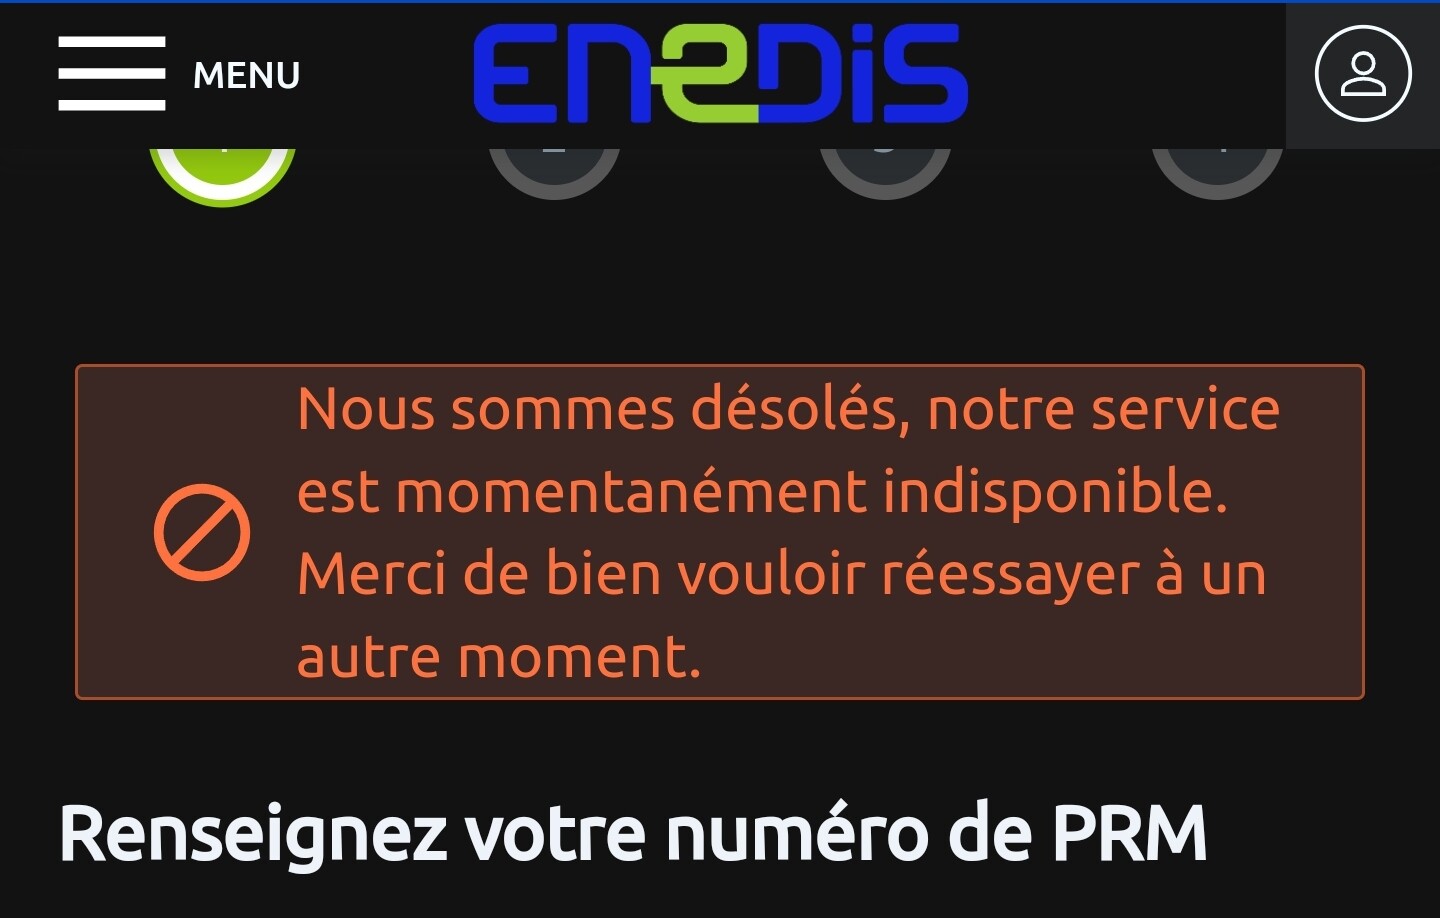
The Enedis API is temperamental and often down.
I designed this integration so that, for the user, this chronic instability is as transparent as possible.
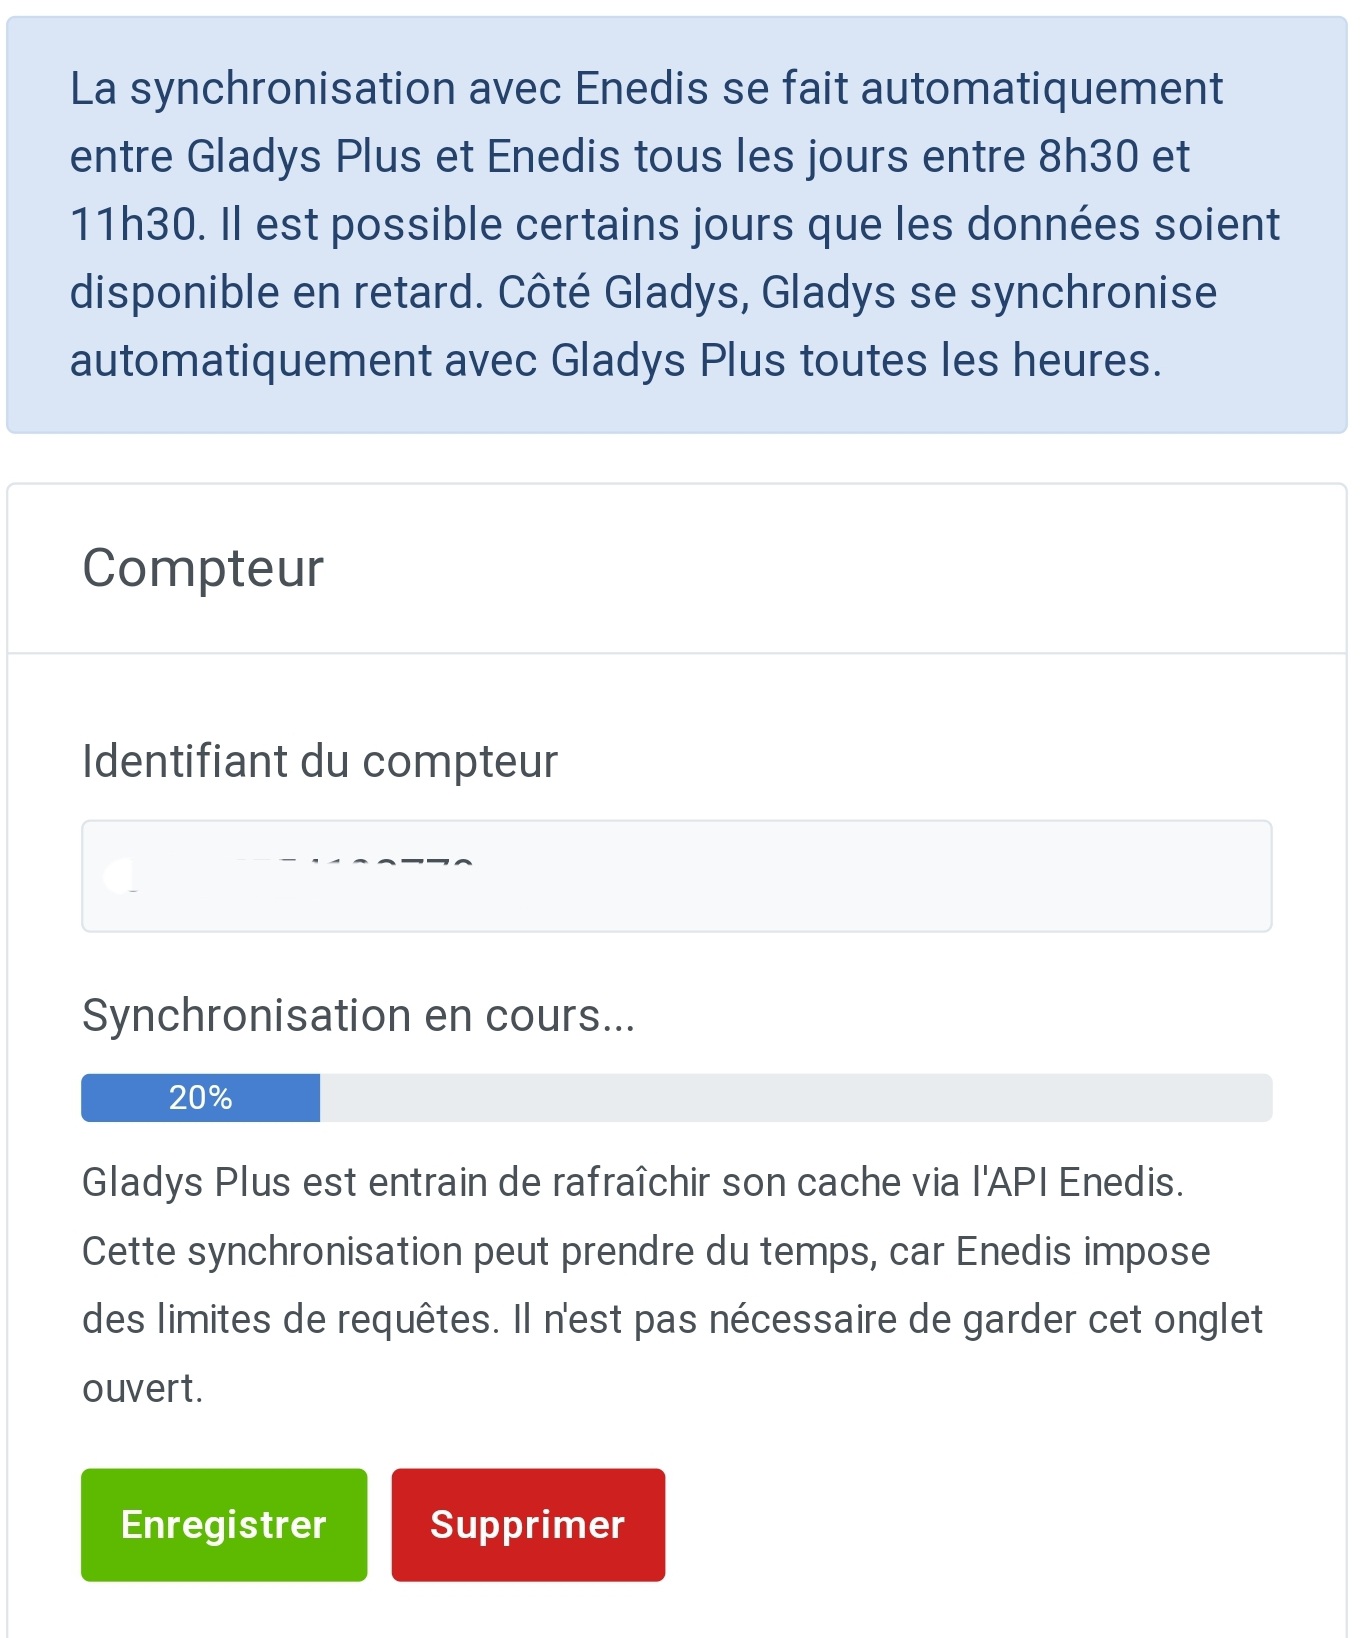
Gladys Plus (server) syncs regularly with the Enedis API, and then locally the instances sync with Gladys Plus.
On Enedis’ side, the previous day’s electricity consumption data is published every day between 8:00 and 10:00.
Gladys Plus will attempt to synchronize this data several times from 8:30 to 11:30. Depending on the state of the Enedis API (heavy load in the morning), the data will be available sooner or later.
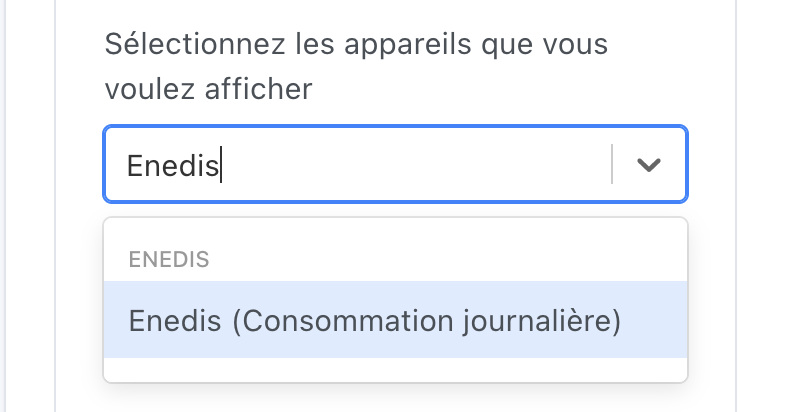
For now, this data is displayed via an « Enedis (daily consumption) » feature, available in the « Graph » view:
This alpha does NOT include the advanced display proposals I suggested on the « Enedis Integration » thread:
- No special electricity consumption box on the homepage
- No cost management (calculation of consumption in €)
I preferred to split this development into two parts, to start collecting feedback on this first part, and to better understand the demand.
It’s also a question of motivation, because working for several months in the dark without it serving anyone isn’t very motivating ![]()
Prerequisites
- Have an account on enedis.fr
Connecting to Enedis
Go to Gladys Plus, and click this button:
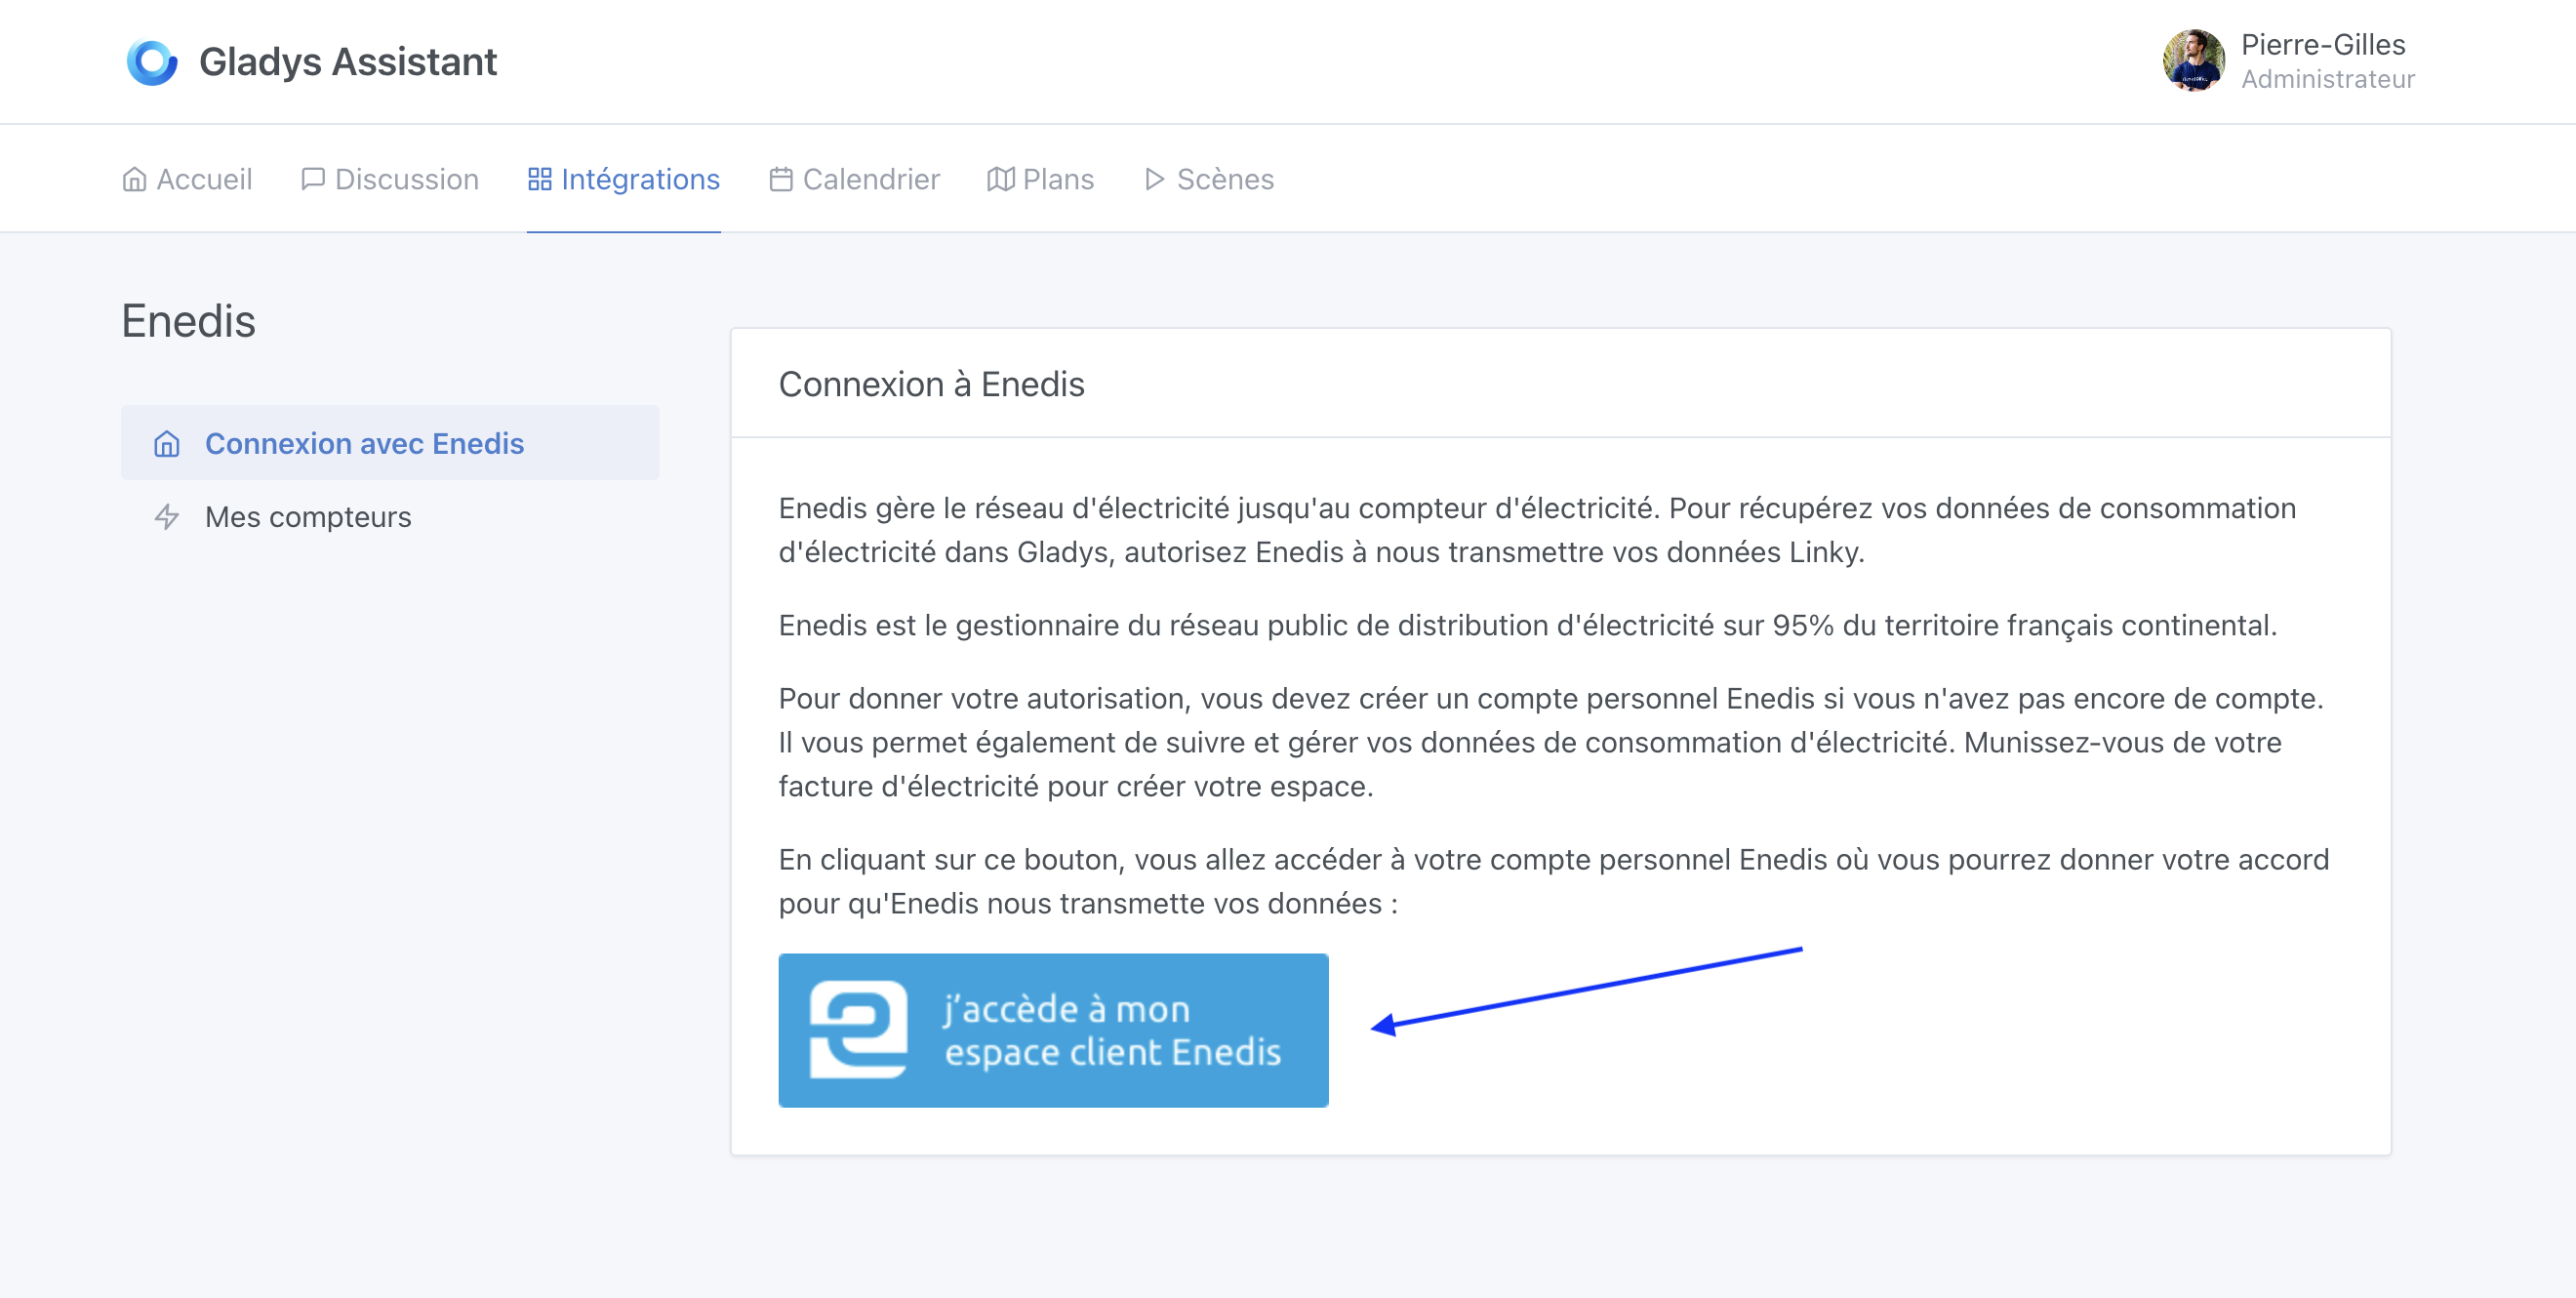
Gladys Plus will sync with Enedis.
The first synchronization can take several hours, don’t panic ![]()
Zigbee2mqtt bug fix
This update fixes the Zigbee2mqtt bug that several of you noticed during the latest Gladys updates.
The bug was very tricky and not easy to reproduce!
If you want to know more:
The bug is now fixed in v4.20.
Dashboard display bug fix
Several of you reported the bug: the dropdown in the « room devices » box was sometimes hidden vertically by the fixed bottom bar of the screen.
This bug is now fixed ![]()
MQTT integration bug fix
In the MQTT integration, a bug could occur in certain cases and display « ******** » instead of the password, even when clicking the « Show password » button.
This bug was fixed by @AlexTrovato, thank you ![]()
Ongoing work
- I’m still working on displaying live cameras on the dashboard
- I’ll probably do a bugfix/UX pass once the « live camera » feature is released
Changelog
The full CHANGELOG is available here .
How to update?
If you installed Gladys with the official Raspberry Pi OS image, your instances will update automatically in the coming hours. This can take up to 24 hours, don’t worry.
If you installed Gladys with Docker, make sure you are using Watchtower (See the documentation )