These bugs come from the library we use to display the charts, ApexCharts.
I noticed that they have recently made good progress on bug fixes for that library (they went from 600 issues to 288), and I wanted to re-test by doing a build with the new version (v3.41.1 instead of v3.29.0 currently).
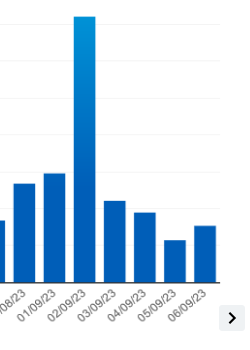
@Riquet0077 Where do these data come from and what do they look like?
Your first screenshot last year showed something very different, and I thought it was a bug in the library, but this looks very different!
If you have a way to send me the data, or even your entire Gladys database, that would be perfect! (Be sure to stop Gladys before making a copy of your database if you do.)
Pierre-Gilles,
These are electric consumption data from my smart meter (Linky in France) via a gateway that sends them over MQTT.
I can send you my database but I don’t know how to do it. Is there a tutorial on the forum?
At the time I had made you an admin on Gladys Plus!
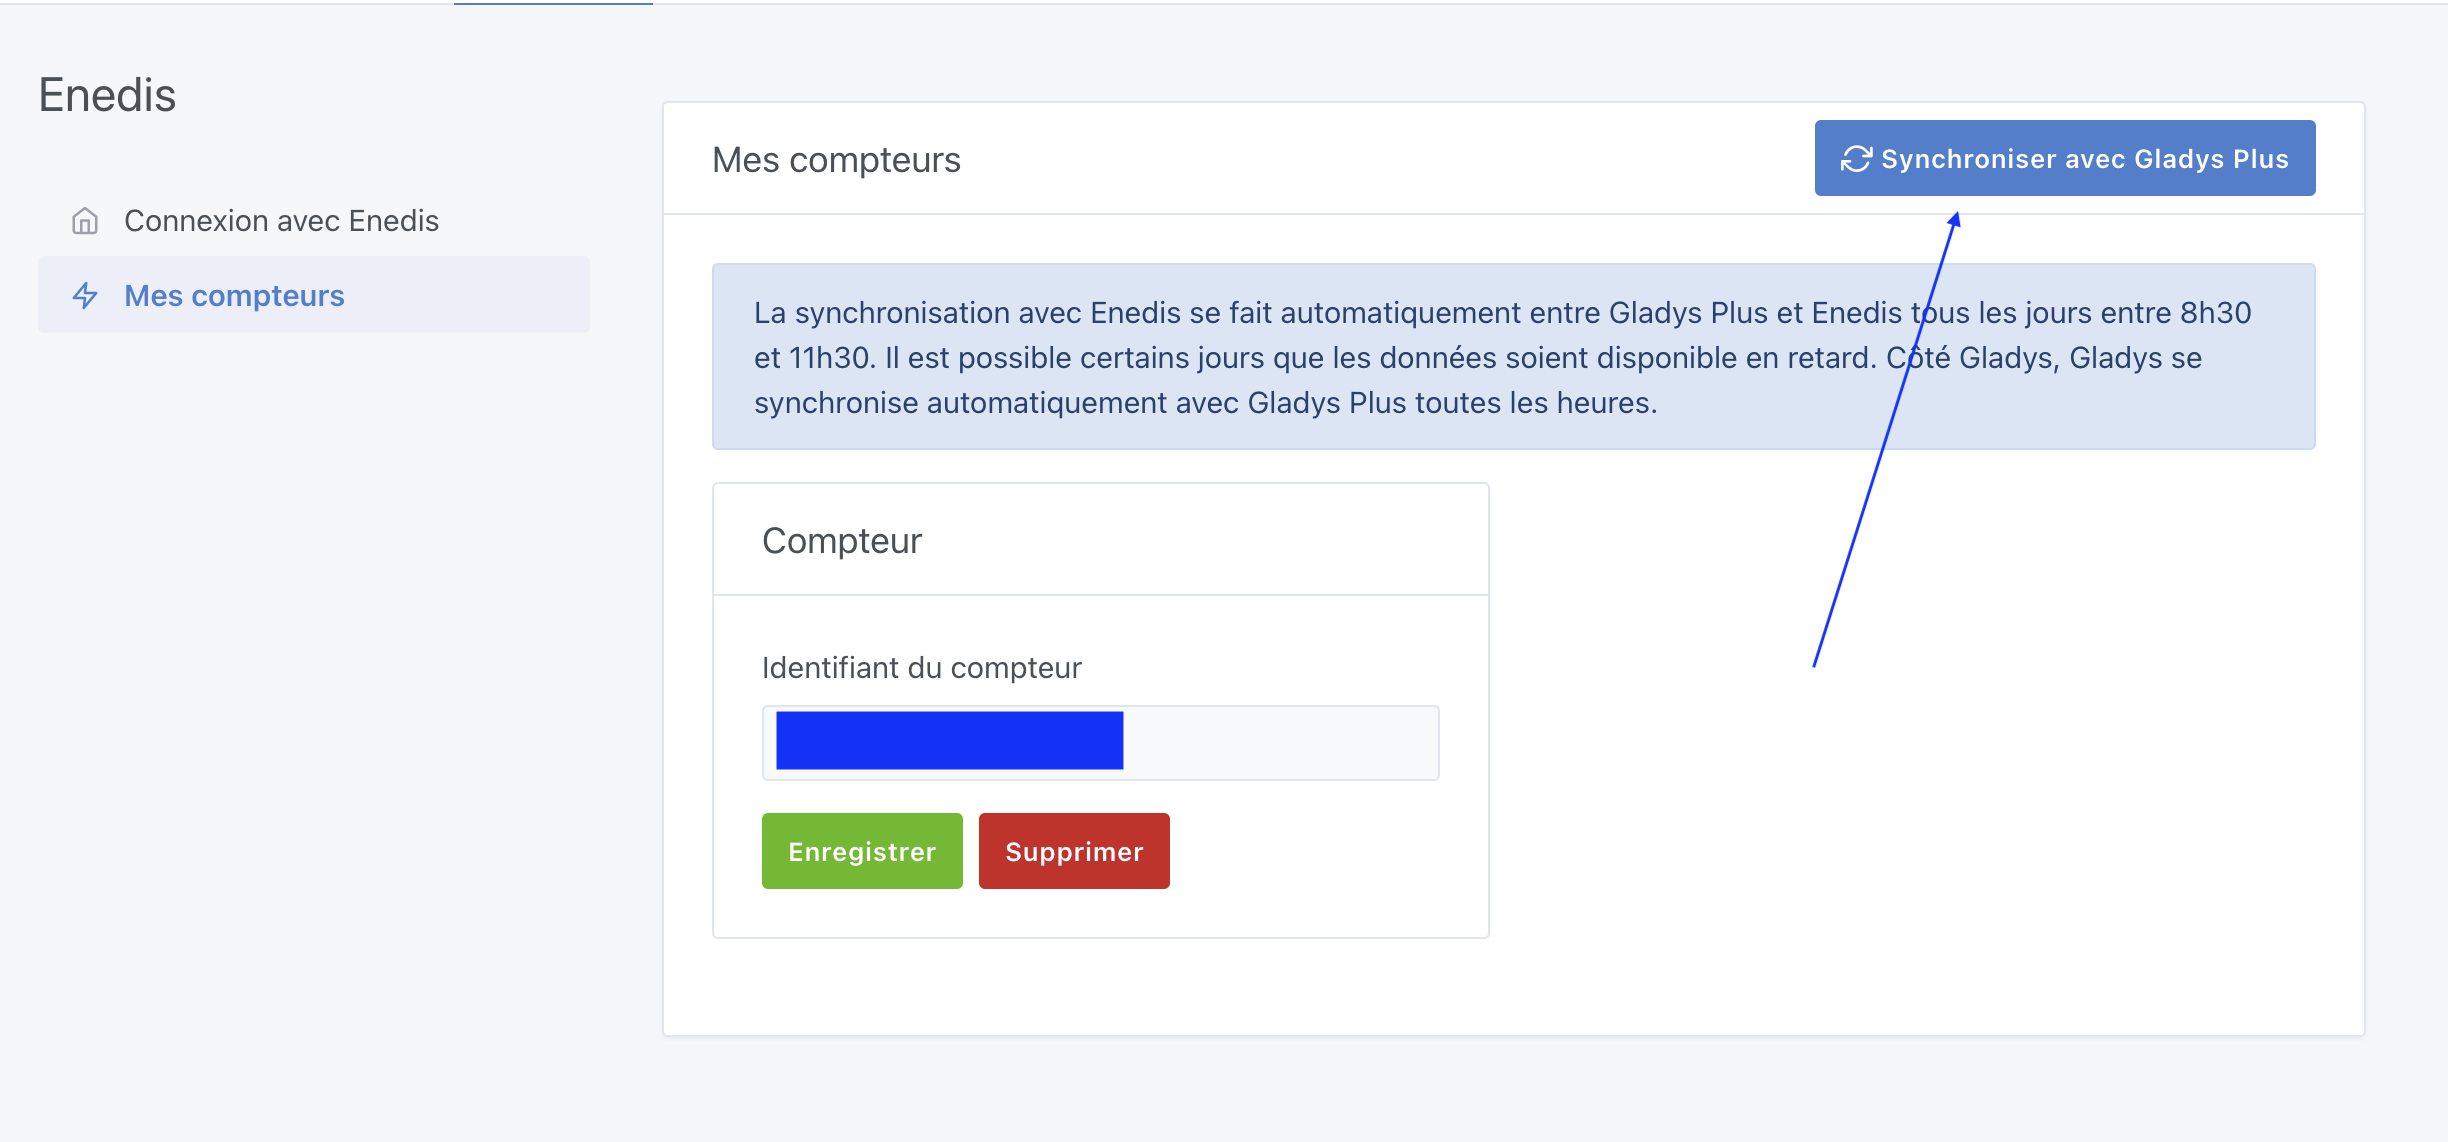
Okay, I checked on the Gladys Plus side, and indeed some data was missing from your account for those dates. This can come either from an outage of the Enedis API (it happens), or from a temporary gap in the data reporting, a gap that was later filled retroactively — except that Gladys Plus then « missed » those data during the daily synchronizations.
I re-ran a full sync of your account to retrieve the data locally; you can click this button:
To be sure, I restarted a full synchronization of all Gladys Plus accounts; it’ll take a little while I’ll post a message for the others when it’s done.