Normally, even if the purge hasn’t been done you still have access to the graphs, but I think Gladys was busy with the purge and so it was blocking your system a bit
If you no longer have any states in SQLite, I think you can do a DB cleanup + restart Gladys
So, to be very precise, until about 2 hours ago (so I think until he deleted the data from those sensors), I had the graph view but without new data since the graphs stopped at yesterday around 10:xx, which is when I switched to the new image.
I’m therefore pretty sure I was still on the SQLite DB data until the deletion. New data were indeed being written into DuckDB since the number of states was increasing.
No, that’s impossible, the SQLite code was removed, it’s not in the duckDB image. You may have had some display caching, but it didn’t come from your database.
As if it had missed the state updates (while DuckDB was correctly incrementing in the system counter)
Also, something that didn’t seem to be an issue before: I have a value « Vitesse pattern » that takes the last value received on the MQTT network (from any topic)
I’m surprised it’s that large… Do you indeed have 0 states in SQLite? Did you restart Gladys after cleaning the DB?
Normally you should end up with a very small DB (a few MB max).
Run another purge then ^^ Maybe there’s still data in the aggregate table
In your case, given the size of your DB and the slowness of the purge, maybe Gladys missed some states since the system was « busy » cleaning.. Unfortunately it’s lost, you’ll have a gap for those periods.
I doubt that’s related, but if you have more info don’t hesitate
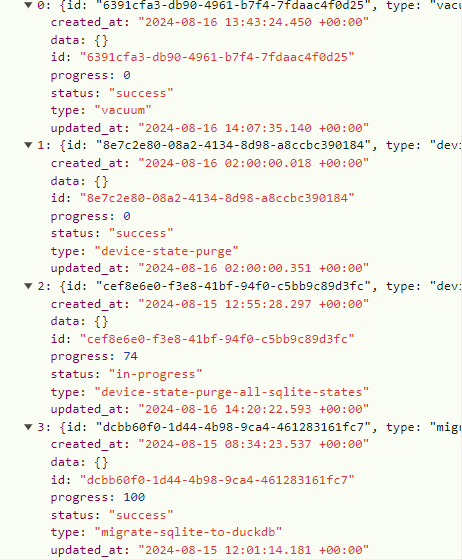
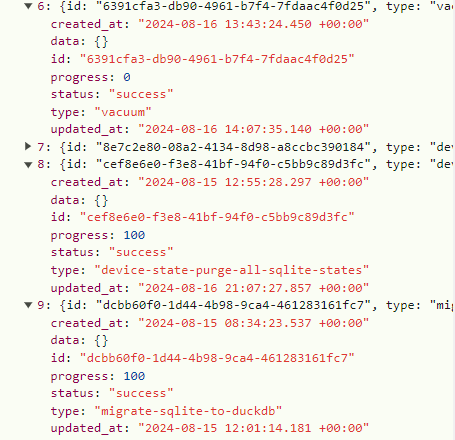
Even though I already find that great (^^) yes it surprises me too ^^ as I told you earlier, yes I do have 0 states in SQLite on the system tab, but the purge task was still running:
I’m waiting for it to finish before restarting. I’ll do another purge and cleanup afterwards.
The database cleanup also seemed very fast to me compared to the last time I did it when the DB was much lighter.
I’ll take the opportunity to clear the browser cache as well.
I’ll give another update afterwards.
If that’s all it is, it’s not a big deal ^^ I was mainly afraid that all the historical data would be deleted ^^
Really wait until the purge is finished, then run your vacuum. On my end, I had to redo the entire procedure (after restarting Gladys) for the tasks to be completed in full…
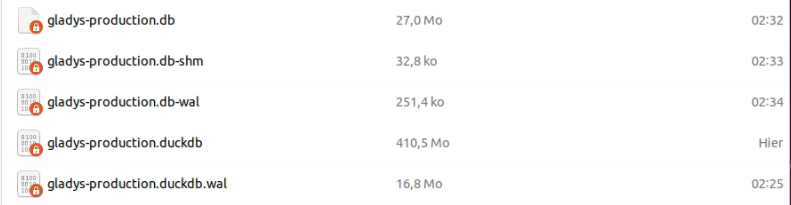
SQLite DB before cleaning: 47.7 GB
DuckDB DB after migration: 410 MB
SQLite DB after cleaning: 1.1 GB => 27 MB after cleaning the t_message table Gain: 47.7 - (1.1 + 0.41) = 46.2 GB i.e. -97% ^^
So my bad, it’s so quick to open the DB now that I went to see what was taking 1 GB in SQLite, and it turns out I had 3 million rows in the t_message table containing the text ‹ Test lumière auto on/off ›.
So I deleted them all (maybe think about having an option to clean this part anyway because in my case it must be a scene I made wrong …) :
Gain: 47.7 - (0.03 + 0.41) = 47.26 GB i.e. -99% ^^
Backup DB before migration: 12.28 GB
Backup DB after migration: 694 MB => 408 MB after cleaning the t_message table Gain: 12.28 - 0.694 = 11.586 GB i.e. -94% ^^
Gain: 12.28 - 0.408 = 11.872 GB i.e. -97% ^^
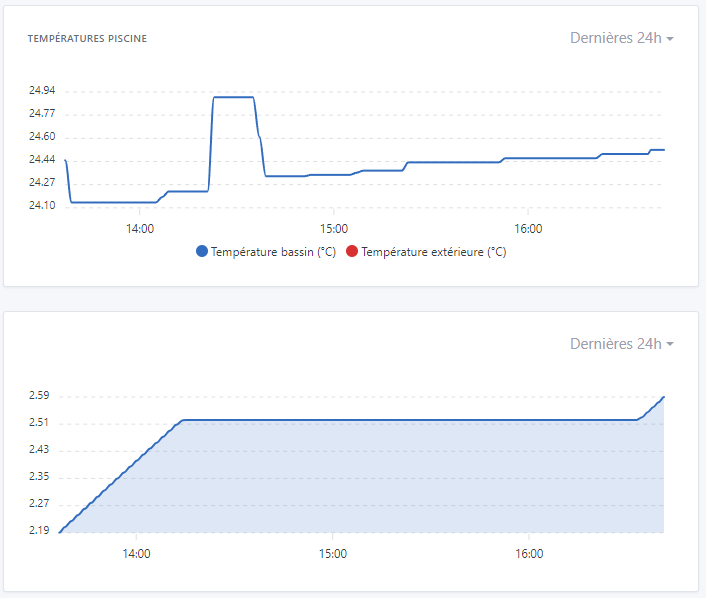
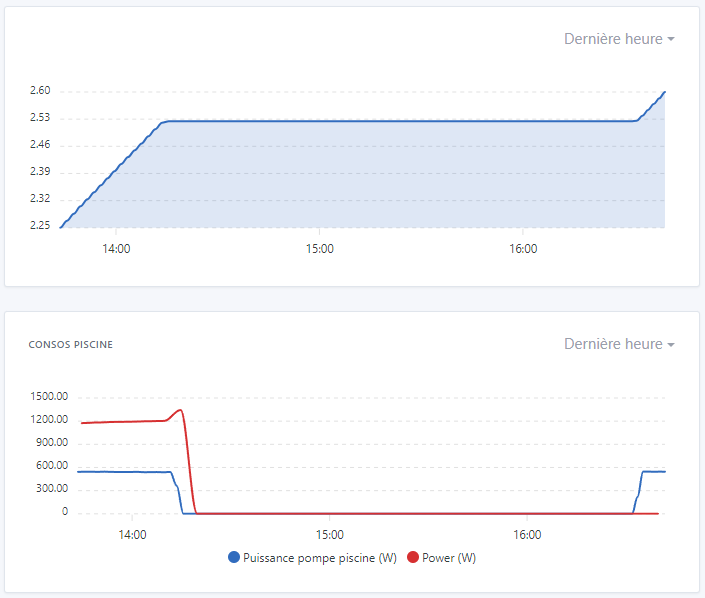
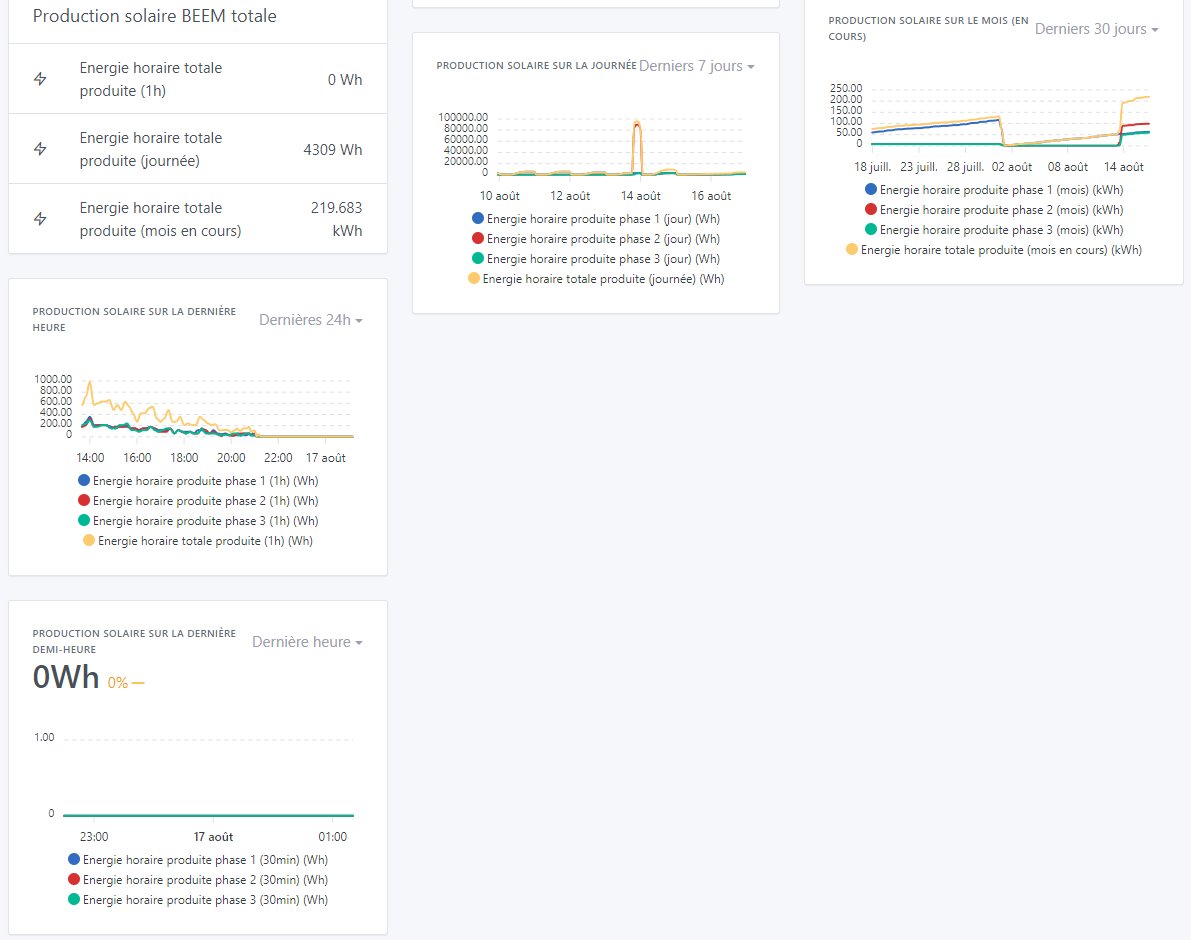
And as you said, chart display is instantaneous whether in 24h, 1h or mixed periods. Now we just have to have fun with the PRs underway for wider chart visualizations ^^!! Impressive!
By the way on 11 dashboard pages, of which 4 pages contain 4 to 8 charts with multiple features as below, the displays are almost instant (which was far from the case before):
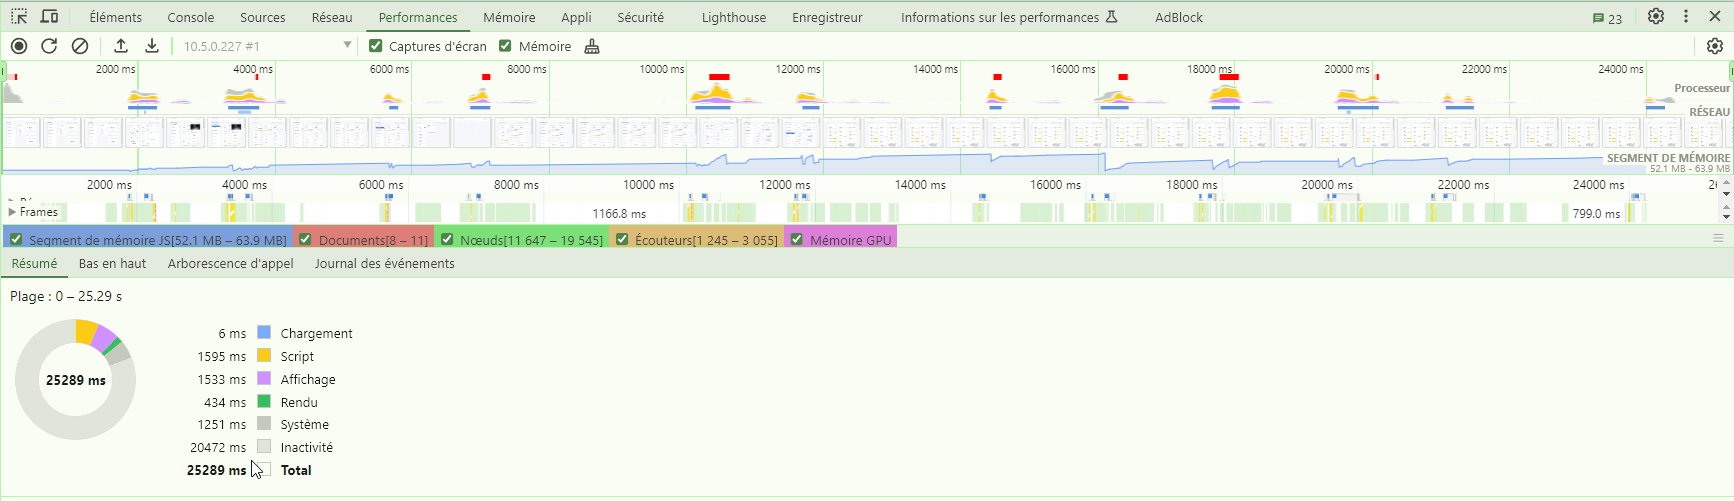
EDIT (if this can give ideas to others who have a slow chat ^^): And since deleting the rows from the t_message table, the chat display has become instantaneous again (haven’t seen that in years ) =>
Great, thanks for the feedback! Indeed, the difference is incredible
For the chat, we should do a daily purge of messages to keep only the 1000 most recent (I don’t know whether it’s worth keeping more, we already do that for background jobs)