Thanks @Checconio for the DB you sent me privately, I was able to perform a small performance audit on your data and it helped me a lot, I found the issue! ![]()
First, the issue was very clear: it was super slow even on my fairly powerful development machine, I don’t know how you manage to cope with that, it was ultra slow ^^
To illustrate, I saw this:
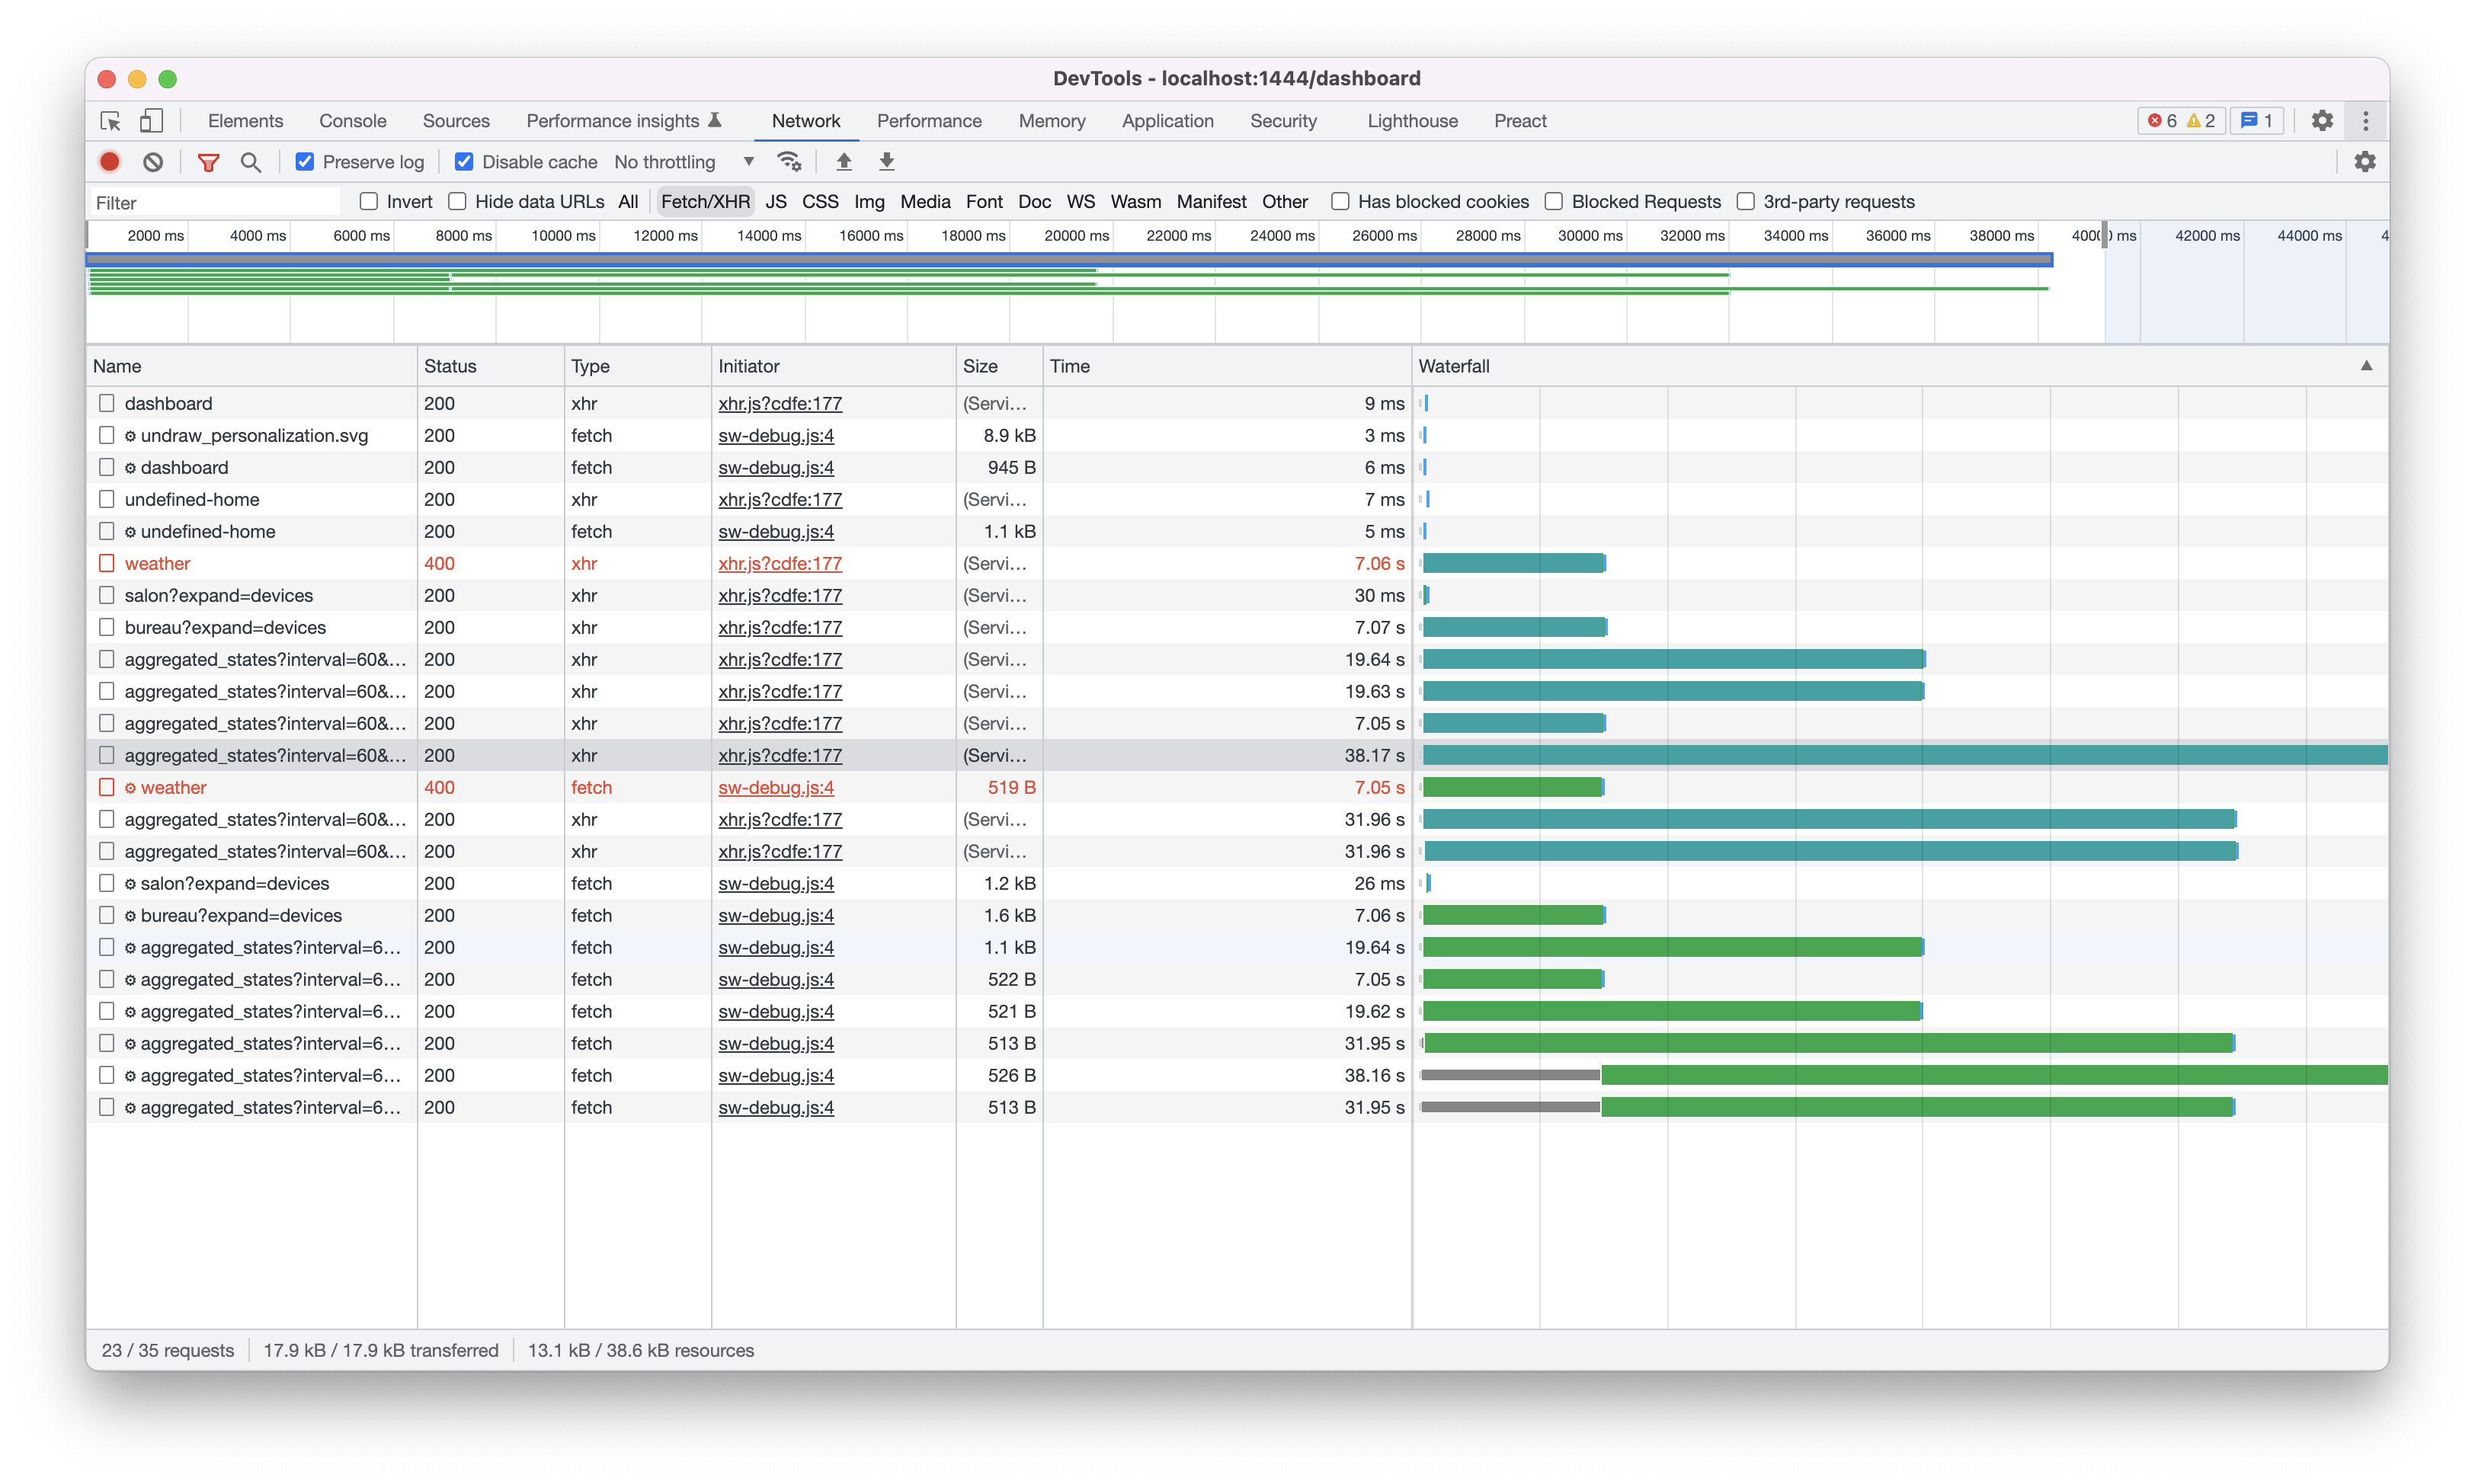
Almost 40 seconds to display the page, that’s just huge ^^
I ran Gladys locally in debug mode to see the executed SQL queries and I ran them manually on the DB, « live ».
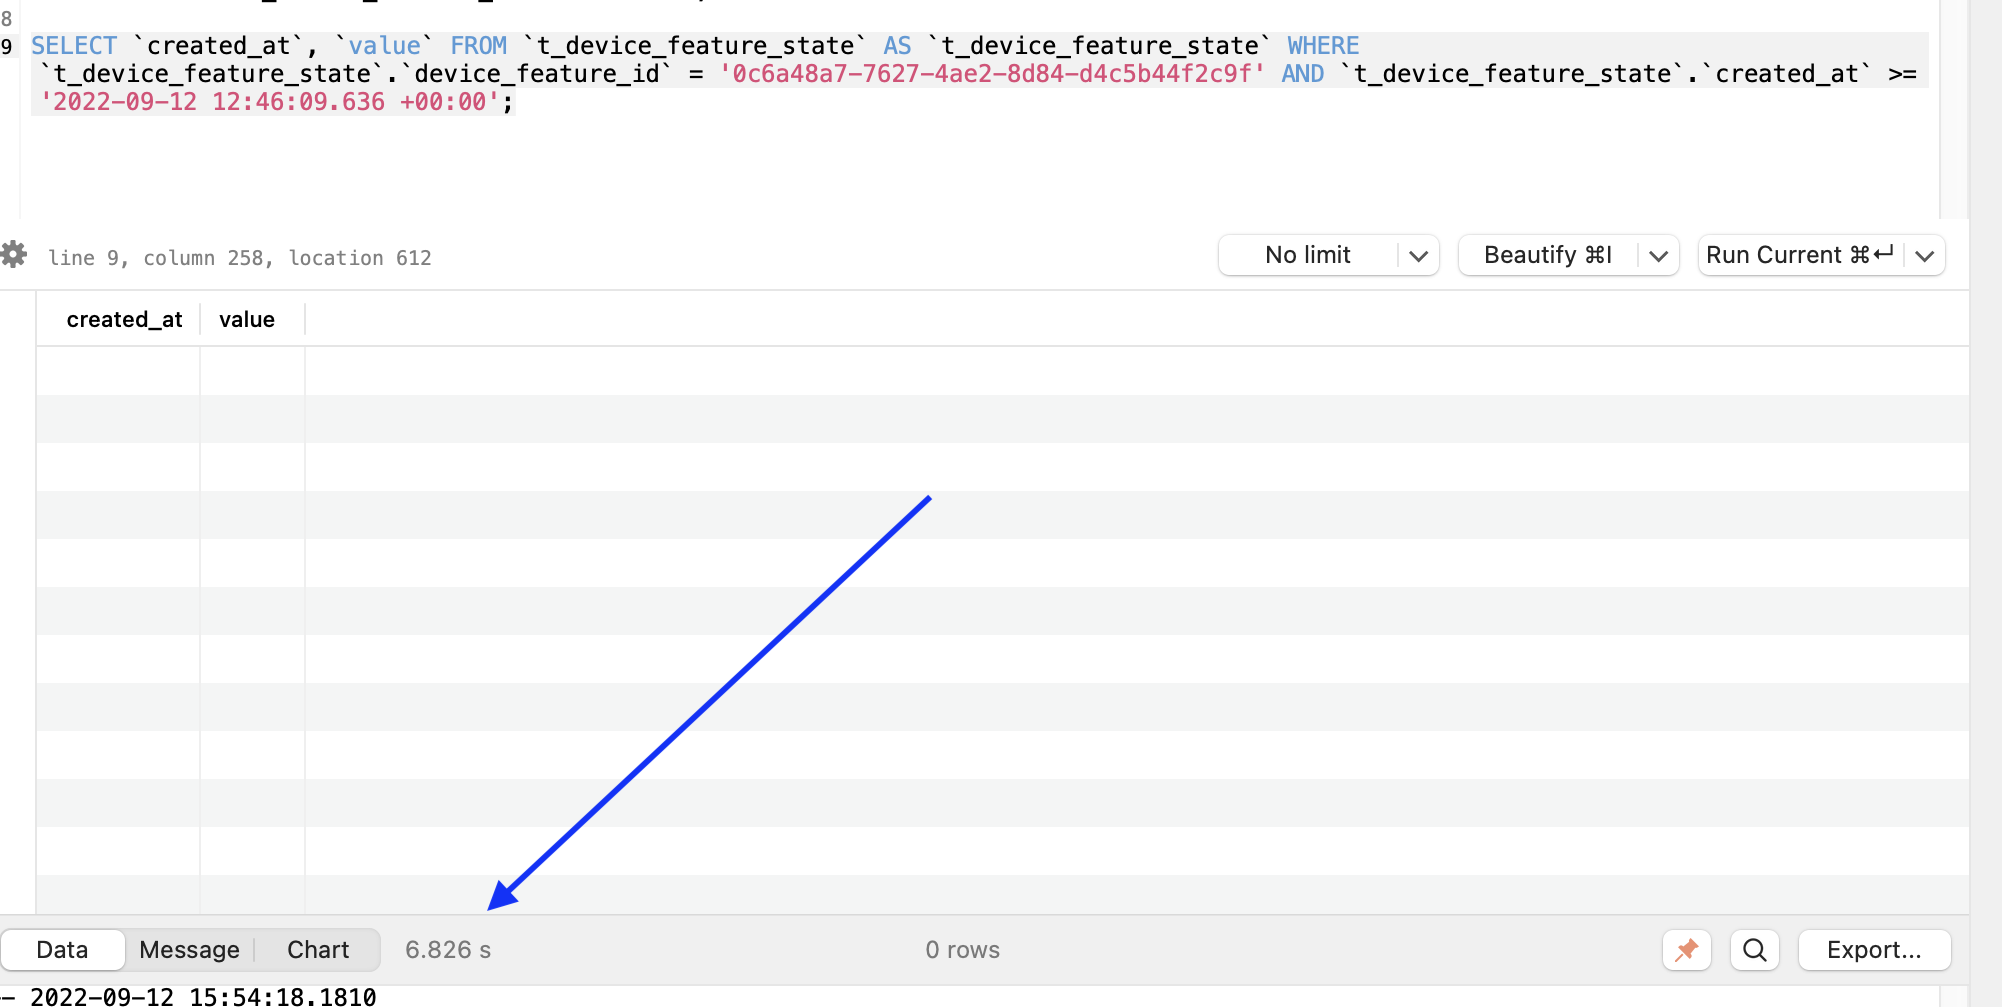
6 seconds for a query that returns nothing, that’s a lot!
So I pulled the thread, there are 2 conditions on this query (WHERE device_feature_id = ? AND created_at >= ?), and both of these attributes do have an index…
I run EXPLAIN QUERY PLAN to understand what SQLite is doing, and I understand.
SQLite could use the index on device_feature_id to fetch all states for that feature, but then it did a sequential scan to filter by date: the index on the date wasn’t used.
The solution is very simple: just add an index that covers the 2 attributes used in the query.
So I added 2 indexes on device_feature_state and t_device_feature_state_aggregate covering the attributes used by the dashboard queries.
await queryInterface.addIndex('t_device_feature_state', ['device_feature_id', 'created_at']);
await queryInterface.addIndex('t_device_feature_state_aggregate', ['device_feature_id', 'type', 'created_at']);
And then: bam! That same query goes from 6 seconds to… 5ms!! ![]()
For the whole page, it goes from 40 seconds to.. 100 ms on my machine!
I told you, it wasn’t due to SQLite, we would have had the same issue on MySQL ![]()
I made a PR that fixes the issue, it will be included in the next Gladys release:
@Terdious @lmilcent this will interest you who have a lot of data!