Displaying sensor curves on the dashboard

Hello everyone!

It’s Monday, back to work :slight_smile:

I’m finishing all the modifications we discussed here:

  • Correction KW → kW
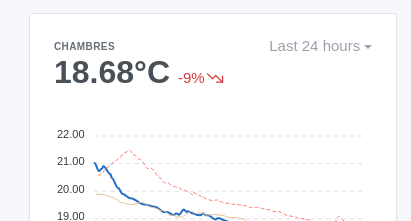
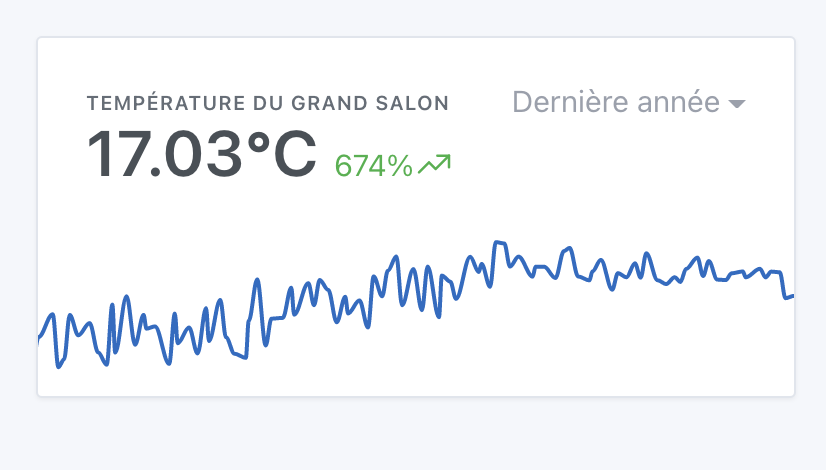
  • Display of the variation for all types of intervals
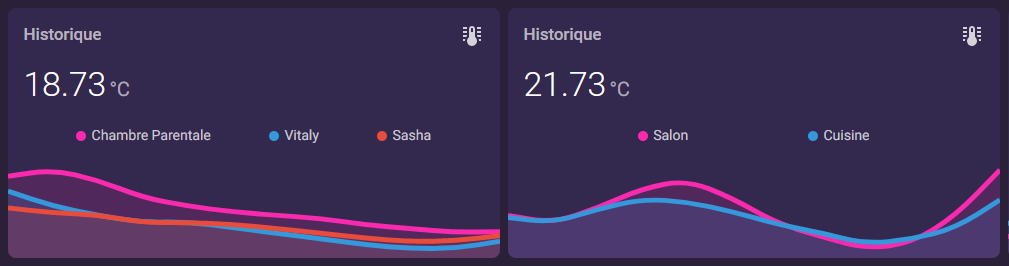
  • Display of multiple features on the same curve (this is the most complex point)

This last point is the most complex!

Here’s where I am for now:

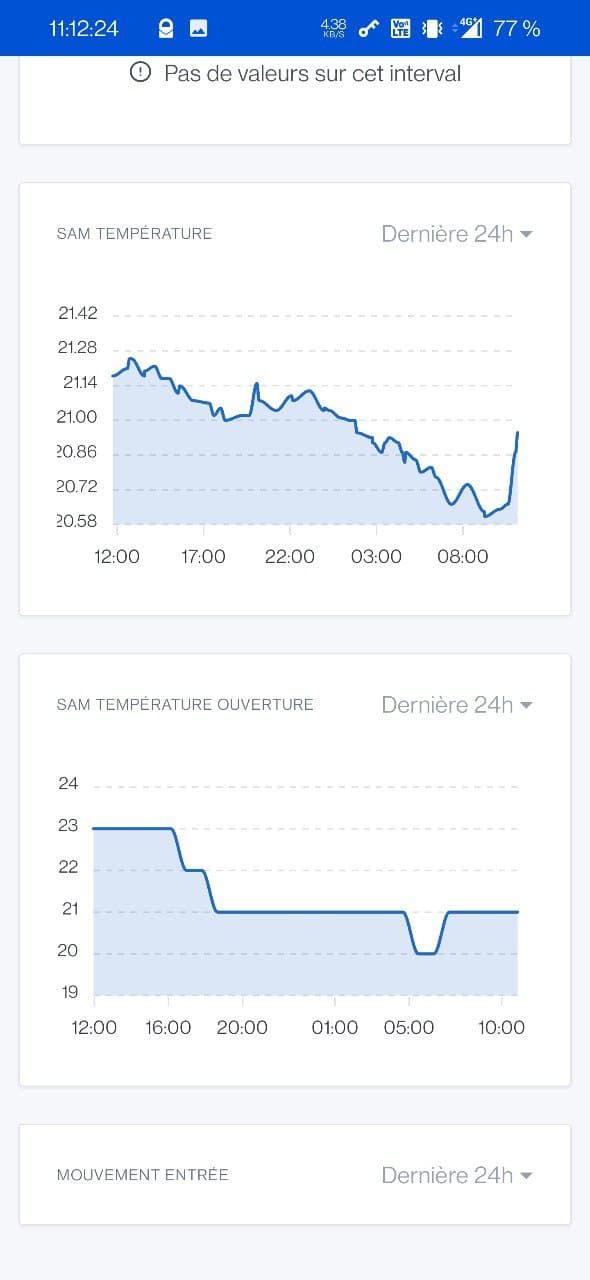
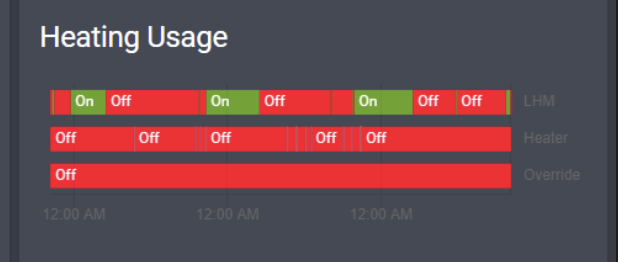
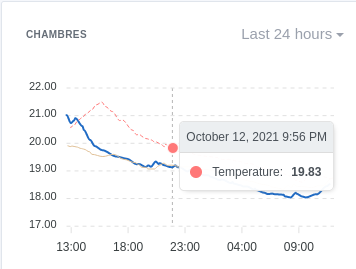
Display of a feature

Basic state, display of a single feature:

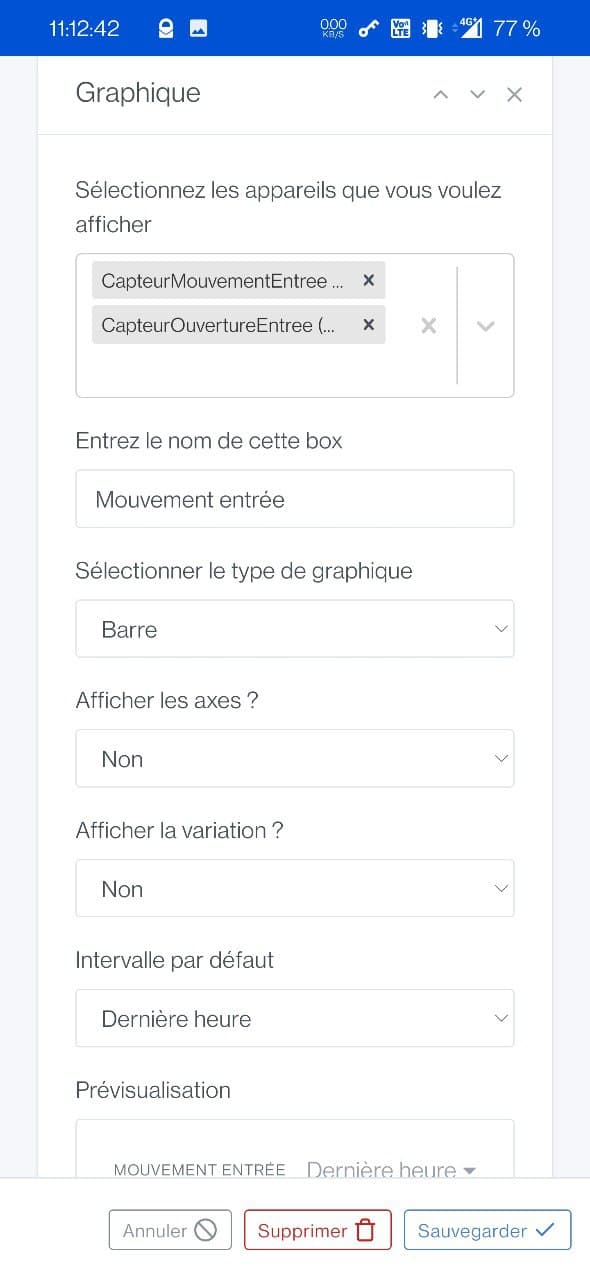
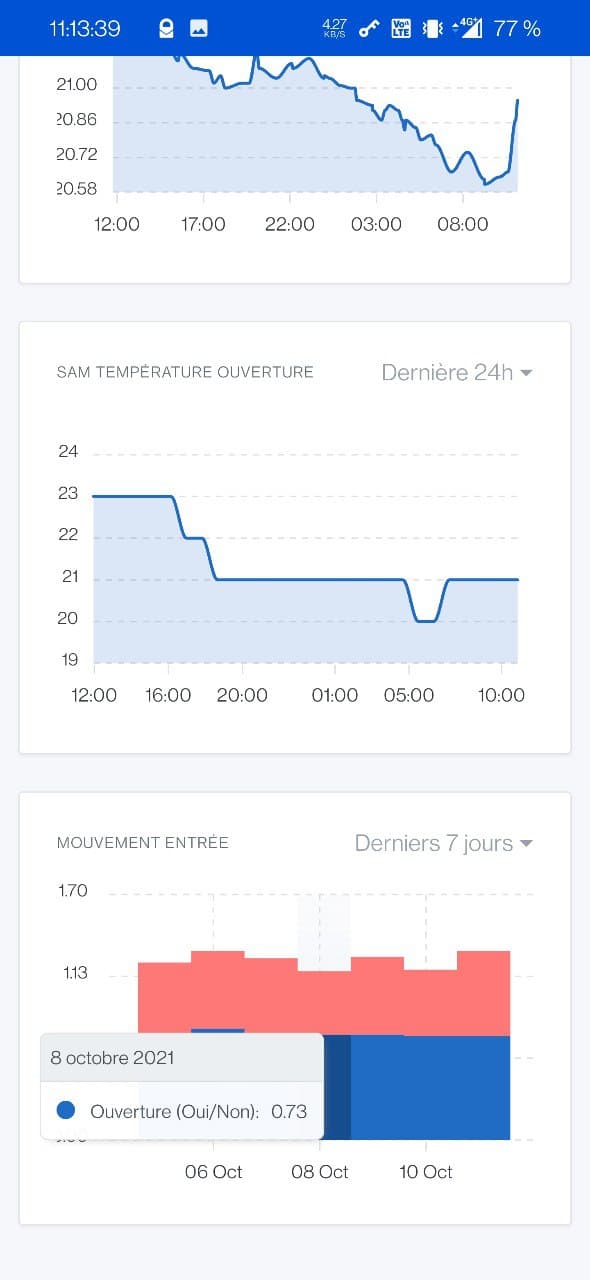
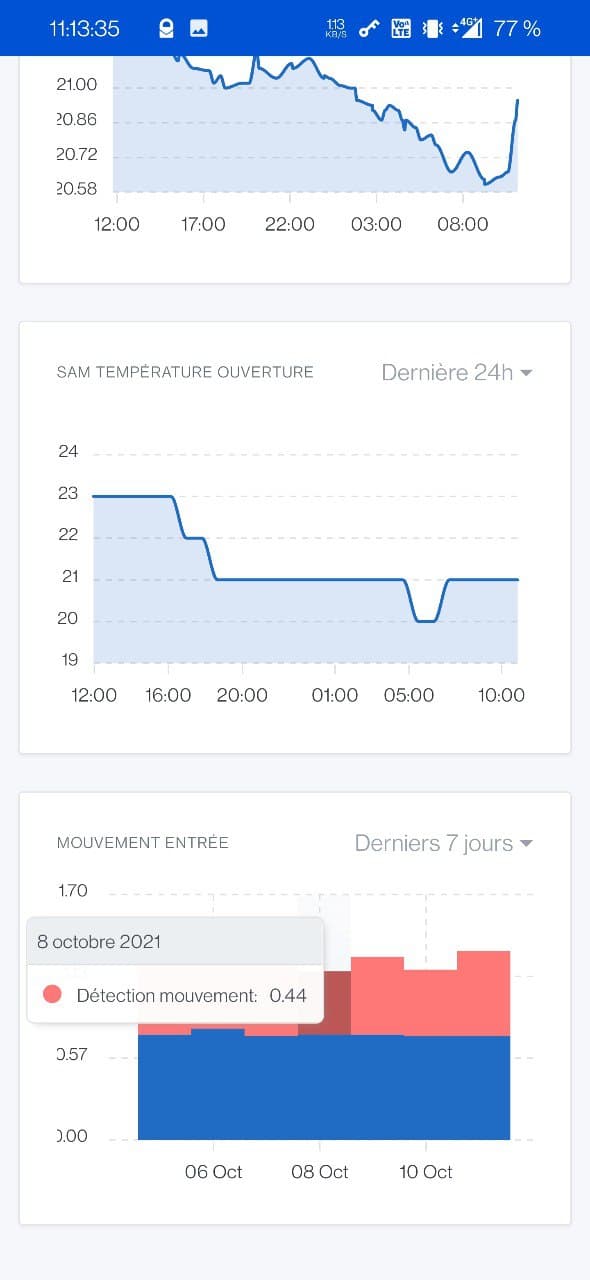
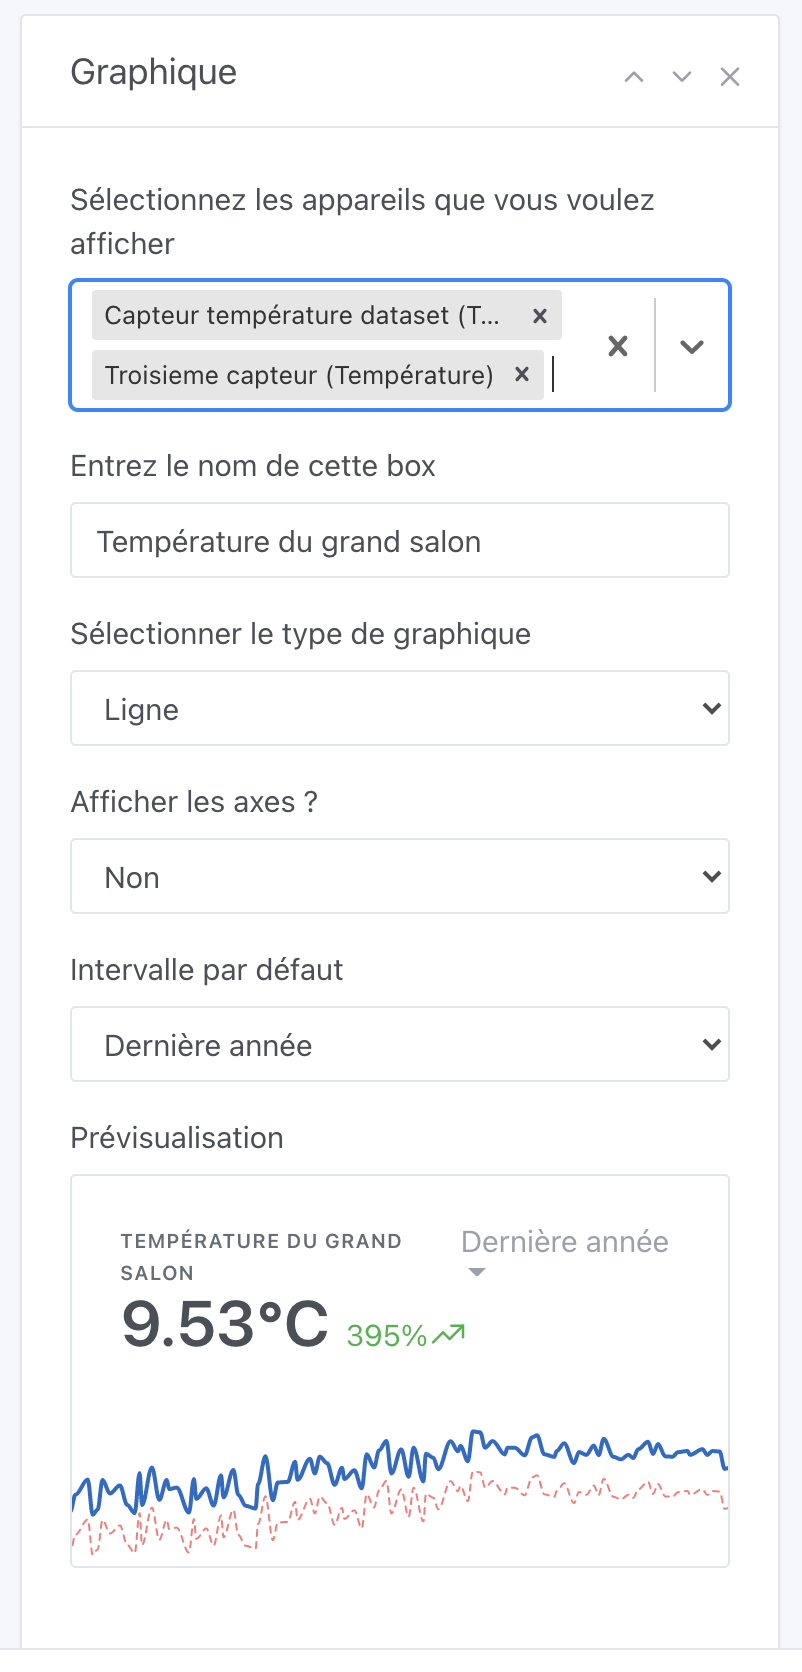
Selection of multiple features

I removed the selection of the room, now it’s in all of Gladys that we search with a multiple selector:

The colors

This is the big debate: what colors to offer?

What do you think if I propose a list of colors that is assigned to the different sensors? (No possibility to choose)
Or is it really crucial to be able to manually select a color for each device?

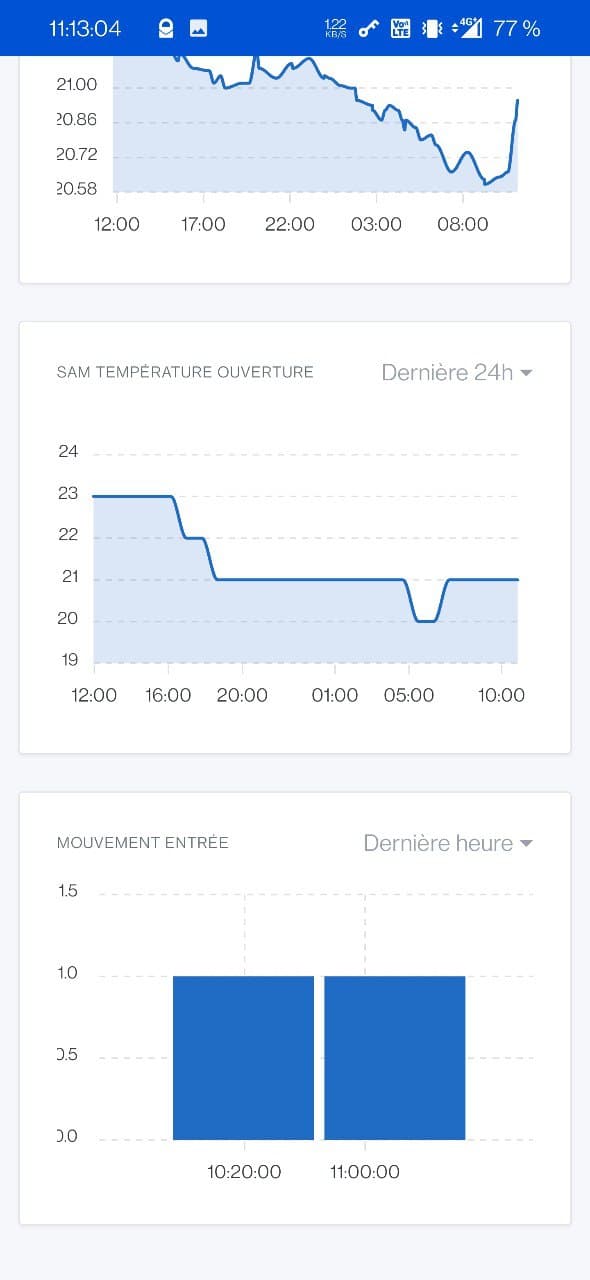
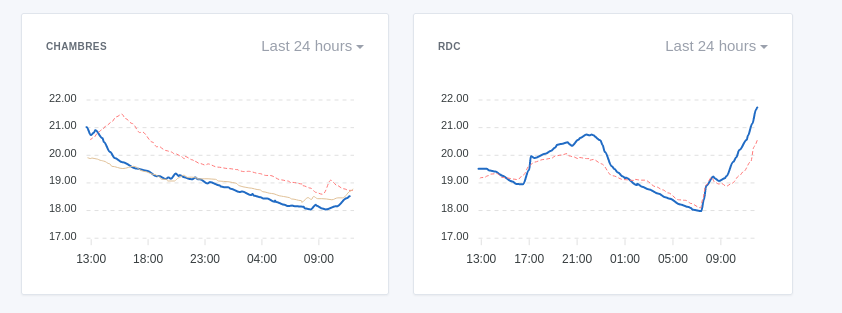
For now, it looks like this:

I found a slightly pastel color palette on https://colorhunt.co/

If anyone has better taste than me, I’m open to any feedback to find better color sets, knowing that the constraint is that we need colors that are a good balance between eye-catching and too subdued.

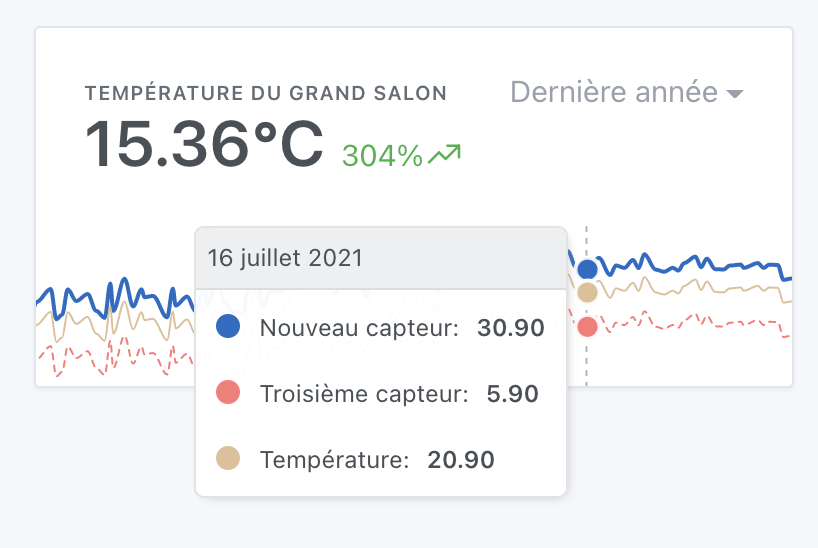
Calculation of the variation and the displayed value in bold

For now, the value displayed in bold is the average of all the last values of each series.

The variation is the average variation of all the series.

What do you think?

Hello,

For the colors, you might need to pay attention to one point (this is not my case), but: In **France**, the proportion of **colorblind** people is approximately 8% among men

So either you have to choose the colors, or colors that are suitable for colorblind people. At work, I have people who can’t see anything in the PR review :smiley:

In any case, the rendering is really great! :slight_smile:

Oh yes, that’s true! Are the selected colors here okay? Can you see them?

I’m not color blind myself, it’s fine, but I had a case at work, that’s why I’m bringing up the information. Either we have someone who is color blind and can help us, or we have to read articles to know what’s best :smiley:

Given that there are multiple levels, it would indeed be best if a colorblind person could help us out and give their opinion. (Are your colleagues available? :smiley:)

I’ve done tests with a simulator, it’s sure it’s not as visible as seeing the colors, but I still find it readable:

AMHA, this view as you said so well must be complete but as simple as possible. It will be very good to see the need to be able to select the colors on a dedicated view. But on the dashboard, it’s just a quick piece of information that we want. No use in letting the choice for me. However, if it’s easy to program if the colors are linked to the order of selection, why not. Otherwise, I don’t see the point.

Very good for me the pastel colors

Is it possible to have a checkbox for displaying or not the value and the variation? In some cases it is useful, in others much less:

  • 1st case: I want the average temperature of the floor, I display everything and the average as well as the variation: Interesting :white_check_mark:
  • 2nd case: I am in three-phase, I display the powers (same for total energy consumed) of my 3 phases to have a direct overview, it is the total that I would need, the average and the variation of this average is not interesting to me.

So having the possibility to select the average, the sum or no display would be the top of the top!!

Well seen @damalgos for the colorblind!!

Edit - Small links on the subject (especially the combination with green to avoid):

I agree :+1: Thanks for the quick feedback :slight_smile:

It’s possible!

By the way, I almost forgot, @Terdious I added some logs (temporary) so that you can see what’s taking time in the requests to try to optimize if possible :slight_smile:

As soon as I push a new version I’ll let you know @Terdious, and you’ll see with each request a complete detail of all the steps of a GET in the logs:

Yep, I’ll ask :slight_smile:

For information, I just made a new build on the tag :chart like the previous builds!

I’m open to your feedback!

@Terdious You in particular, I would be interested in having your server logs when you load your dashboard :slight_smile: The goal is to see possible performance improvements!

And here it is… ^^

Logs on display
2021-10-11T13:34:56+0200 <info> device.calculateAggregate.js:105 (ChildProcess.<anonymous>) device.calculateAggregate: Finishing processing for interval daily
2021-10-11T13:34:56+0200 <info> device.calculateAggregate.js:38 (DeviceManager.calculateAggregate) Calculating aggregates device feature state for interval monthly
getDeviceFeaturesAggregates.findingDeviceFeatureInDb(puissance-phase-1-centre-equitherapie): 3.76ms
getDeviceFeaturesAggregates.gettingRowsFromLiveDb(puissance-phase-1-centre-equitherapie): 546.242ms
getDeviceFeaturesAggregates.buildingDownsamplingArray(puissance-phase-1-centre-equitherapie): 0.065ms
getDeviceFeaturesAggregates.downsamplingData(puissance-phase-1-centre-equitherapie): 0.029ms
getDeviceFeaturesAggregates.findingDeviceFeatureInDb(puissance-phase-3-centre-equitherapie): 16.096ms
getDeviceFeaturesAggregates.findingDeviceFeatureInDb(energie-phase-2-centre-equitherapie): 17.111ms
getDeviceFeaturesAggregates.findingDeviceFeatureInDb(energie-phase-3-centre-equitherapie): 22.345ms
getDeviceFeaturesAggregates.findingDeviceFeatureInDb(puissance-phase-2-centre-equitherapie): 25.22ms
getDeviceFeaturesAggregates.findingDeviceFeatureInDb(energie-phase-1-centre-equitherapie): 27.017ms
2021-10-11T13:34:57+0200 <warn> message.connect.js:19 (TelegramBot.<anonymous>) Telegram polling error, code = ETELEGRAM, message = ETELEGRAM: 409 Conflict: terminated by other getUpdates request; make sure that only one bot instance is running
getDeviceFeaturesAggregates.gettingRowsFromLiveDb(puissance-phase-3-centre-equitherapie): 1.533s
getDeviceFeaturesAggregates.buildingDownsamplingArray(puissance-phase-3-centre-equitherapie): 0.064ms
getDeviceFeaturesAggregates.downsamplingData(puissance-phase-3-centre-equitherapie): 0.042ms
getDeviceFeaturesAggregates.gettingRowsFromLiveDb(puissance-phase-2-centre-equitherapie): 1.612s
getDeviceFeaturesAggregates.buildingDownsamplingArray(puissance-phase-2-centre-equitherapie): 0.064ms
getDeviceFeaturesAggregates.downsamplingData(puissance-phase-2-centre-equitherapie): 0.045ms
getDeviceFeaturesAggregates.findingDeviceFeatureInDb(energie-totale-phase-1-centre-equitherapie): 1.609s
getDeviceFeaturesAggregates.gettingRowsFromLiveDb(energie-phase-1-centre-equitherapie): 1.614s
getDeviceFeaturesAggregates.buildingDownsamplingArray(energie-phase-1-centre-equitherapie): 0.035ms
getDeviceFeaturesAggregates.downsamplingData(energie-phase-1-centre-equitherapie): 0.045ms
getDeviceFeaturesAggregates.gettingRowsFromLiveDb(energie-phase-2-centre-equitherapie): 1.625s
getDeviceFeaturesAggregates.buildingDownsamplingArray(energie-phase-2-centre-equitherapie): 0.041ms
getDeviceFeaturesAggregates.downsamplingData(energie-phase-2-centre-equitherapie): 0.045ms
getDeviceFeaturesAggregates.gettingRowsFromLiveDb(energie-phase-3-centre-equitherapie): 1.627s
getDeviceFeaturesAggregates.buildingDownsamplingArray(energie-phase-3-centre-equitherapie): 0.046ms
getDeviceFeaturesAggregates.downsamplingData(energie-phase-3-centre-equitherapie): 0.028ms
getDeviceFeaturesAggregates.gettingRowsFromLiveDb(energie-totale-phase-1-centre-equitherapie): 540.866ms
getDeviceFeaturesAggregates.buildingDownsamplingArray(energie-totale-phase-1-centre-equitherapie): 0.066ms
getDeviceFeaturesAggregates.downsamplingData(energie-totale-phase-1-centre-equitherapie): 0.027ms
getDeviceFeaturesAggregates.findingDeviceFeatureInDb(energie-totale-phase-2-centre-equitherapie): 12.678ms
getDeviceFeaturesAggregates.findingDeviceFeatureInDb(energie-phase-1-centre-equitherapie): 16.289ms
getDeviceFeaturesAggregates.findingDeviceFeatureInDb(energie-totale-phase-3-centre-equitherapie): 101.751ms
getDeviceFeaturesAggregates.gettingRowsFromLiveDb(energie-phase-1-centre-equitherapie): 91.539ms
getDeviceFeaturesAggregates.buildingDownsamplingArray(energie-phase-1-centre-equitherapie): 0.045ms
getDeviceFeaturesAggregates.downsamplingData(energie-phase-1-centre-equitherapie): 0.028ms
getDeviceFeaturesAggregates.gettingRowsFromLiveDb(energie-totale-phase-2-centre-equitherapie): 627.045ms
getDeviceFeaturesAggregates.buildingDownsamplingArray(energie-totale-phase-2-centre-equitherapie): 0.067ms
getDeviceFeaturesAggregates.downsamplingData(energie-totale-phase-2-centre-equitherapie): 0.03ms
getDeviceFeaturesAggregates.findingDeviceFeatureInDb(puissance-phase-1-centre-equitherapie): 625.273ms
getDeviceFeaturesAggregates.findingDeviceFeatureInDb(energie-totale-phase-1-centre-equitherapie): 968.222ms
getDeviceFeaturesAggregates.gettingRowsFromLiveDb(energie-totale-phase-3-centre-equitherapie): 2.072s
getDeviceFeaturesAggregates.buildingDownsamplingArray(energie-totale-phase-3-centre-equitherapie): 0.087ms
getDeviceFeaturesAggregates.downsamplingData(energie-totale-phase-3-centre-equitherapie): 0.031ms
getDeviceFeaturesAggregates.gettingRowsFromLiveDb(puissance-phase-1-centre-equitherapie): 1.551s
getDeviceFeaturesAggregates.buildingDownsamplingArray(puissance-phase-1-centre-equitherapie): 0.077ms
getDeviceFeaturesAggregates.downsamplingData(puissance-phase-1-centre-equitherapie): 0.079ms
getDeviceFeaturesAggregates.gettingRowsFromLiveDb(energie-totale-phase-1-centre-equitherapie): 1.111s
getDeviceFeaturesAggregates.buildingDownsamplingArray(energie-totale-phase-1-centre-equitherapie): 0.086ms
getDeviceFeaturesAggregates.downsamplingData(energie-totale-phase-1-centre-equitherapie): 0.033ms
getDeviceFeaturesAggregates.findingDeviceFeatureInDb(energie-phase-1-centre-equitherapie): 541.133ms
getDeviceFeaturesAggregates.gettingRowsFromLiveDb(energie-phase-1-centre-equitherapie): 105.614ms
getDeviceFeaturesAggregates.buildingDownsamplingArray(energie-phase-1-centre-equitherapie): 0.047ms
getDeviceFeaturesAggregates.downsamplingData(energie-phase-1-centre-equitherapie): 0.03ms
getDeviceFeaturesAggregates.findingDeviceFeatureInDb(puissance-phase-1-centre-equitherapie): 23.194ms
getDeviceFeaturesAggregates.gettingRowsFromLiveDb(puissance-phase-1-centre-equitherapie): 584.53ms
getDeviceFeaturesAggregates.buildingDownsamplingArray(puissance-phase-1-centre-equitherapie): 0.078ms
getDeviceFeaturesAggregates.downsamplingData(puissance-phase-1-centre-equitherapie): 0.055ms
getDeviceFeaturesAggregates.findingDeviceFeatureInDb(energie-totale-phase-1-centre-equitherapie): 592.441ms
getDeviceFeaturesAggregates.findingDeviceFeatureInDb(energie-phase-1-centre-equitherapie): 533.246ms
getDeviceFeaturesAggregates.gettingRowsFromLiveDb(energie-totale-phase-1-centre-equitherapie): 539.664ms
getDeviceFeaturesAggregates.buildingDownsamplingArray(energie-totale-phase-1-centre-equitherapie): 0.077ms
getDeviceFeaturesAggregates.downsamplingData(energie-totale-phase-1-centre-equitherapie): 0.063ms
getDeviceFeaturesAggregates.gettingRowsFromLiveDb(energie-phase-1-centre-equitherapie): 111.254ms
getDeviceFeaturesAggregates.buildingDownsamplingArray(energie-phase-1-centre-equitherapie): 0.06ms
getDeviceFeaturesAggregates.downsamplingData(energie-phase-1-centre-equitherapie): 0.037ms
getDeviceFeaturesAggregates.findingDeviceFeatureInDb(puissance-phase-1-centre-equitherapie): 10.362ms
getDeviceFeaturesAggregates.findingDeviceFeatureInDb(energie-totale-phase-1-centre-equitherapie): 564.358ms
getDeviceFeaturesAggregates.gettingRowsFromLiveDb(puissance-phase-1-centre-equitherapie): 564.743ms
getDeviceFeaturesAggregates.buildingDownsamplingArray(puissance-phase-1-centre-equitherapie): 0.066ms
getDeviceFeaturesAggregates.downsamplingData(puissance-phase-1-centre-equitherapie): 0.029ms
getDeviceFeaturesAggregates.gettingRowsFromLiveDb(energie-totale-phase-1-centre-equitherapie): 507.625ms
getDeviceFeaturesAggregates.buildingDownsamplingArray(energie-totale-phase-1-centre-equitherapie): 0.072ms
getDeviceFeaturesAggregates.downsamplingData(energie-totale-phase-1-centre-equitherapie): 0.042ms

Magnificent! I’ll get back to you within the week, and I’ll try to see what improvements are possible :+1:

I’m still having a display issue with tasks. But it could also be old notifications :thinking:
@Terdious have you noticed the same thing?

On the graphics side, I can finally display sensor data for opening or movement. However, I still have no data. Is the calculation done when creating a graph?

With the latest update, the NaN issue seems resolved.

For the binary data display part (door opening + motion sensor), I have a few remarks.

  1. The chart does not work if I do not display the axes (possible rollback?), see the last chart « MOUVEMENT ENTREE ».


  1. Displaying the axes allows displaying the chart in bar mode.


  1. The value displayed over 24h, 7d, etc. does not make sense (I think it’s an average of the values). Maybe it would be better to calculate the total number of 1 values received instead.
    For example, it’s more interesting to know that the door was opened on average 9 times each day, rather than the value « 0.75 » which seems to have no logic.

Thanks for testing!

Ok, that must be a UI bug that only appears on your data, I’ll check. Do you have an error in the browser console to help me?

That’s exactly what I thought, the display of binary sensors doesn’t make sense on this graphical view.

I admit that I had enabled binary sensors to please you and see how it looks on your end, but it’s clearly not made for that.

What you describe is a full-fledged development that is out of scope for this one. Should we create a specific feature request? :slight_smile:

I’ll disable the display of binary sensors in this view again :slight_smile:

In itself, I find it makes sense over 24 hours as these are raw data. But the aggregation doesn’t, it would be better to have a sum / period instead.
Do you think it’s too many modifications to adapt the feature and that a dedicated one is needed?

Clearly, I think the ideal would be to have a view a bit like the home assistant:

At least there it’s made for that :slight_smile:

This development is not designed for binary sensors, all the internal operation is based on sampling, which makes sense for temperature values, but makes no sense for binaries: as you said, it’s useless to have a value of 0.75 for a door opening sensor.

I think for binary sensors we need to get around a sheet, do the needs study, find a solution, and then development. It’s a big project, and I don’t think we’ll be able to do something satisfying with what has been done there (which is a completely different project).

So, following our conversation @lmilcent, I deactivated the graphs again for the following devices:

  • Binaries
  • Push
  • Camera
  • Color

For Binaries/Push, we will do a well-done specific development. I know it’s frustrating not to have the feature right away, but it’s more in the spirit of v4 to do things right rather than trying to slap on duct tape everywhere :slight_smile:

@lmilcent Could you create a feature request for us?

By the way, I’m still interested in your browser logs for this :stuck_out_tongue: (I don’t have the bug on my end)

Small feedback with HA comparison

  • I find it lacks contrast (thicker / no dotted lines?)

  • When displaying multiple features, a legend is a significant plus as the tooltip is not helpful

  • With multiple curves + variation, how is this variation calculated? Because on ‹ mouse over › on one of the curves, the variation does not change.


I continue to tinker but it’s starting to look good :slight_smile: