I’m available Friday afternoon if you want, but I don’t know if I’ll have more to tell you than here!
I only see 2 issues with this problem:
Either we want to display the full 24 hours, and so it chugs a bit on the very rare sensors that send a state every 30 seconds… There are surely some small optimizations to make nonetheless for this specific case.
Or we restrict it to 1 hour, but that’s a shame for all the other less verbose binary sensors
I still think that the case of binary sensors that send values every 30 seconds is extremely rare on a typical home installation…
I’d be curious to know what those sensors are!
Hi @pierre-gilles, I’d be happy if we could in any case discuss the data this afternoon. Let me know.
Indeed, for me the first point is essential, but we can’t afford to intentionally spin up instances even if that won’t be the majority of the time (today for example no problem, I only have about 50 states per feature). So I set up some logic, but I’d prefer to speak with you directly.
Specifically for a method of storing binaries (and other things if relevant) which we can look at later.
Following more extensive tests, I observe that :
fetching 3000 states each for 7 non-binary features (3 box charts) displays almost instantly
But fetching 500 states each for 3 binary features (1 box) lags a lot.
I therefore suppose that the heavy compression of binary values impacts decompression performance?
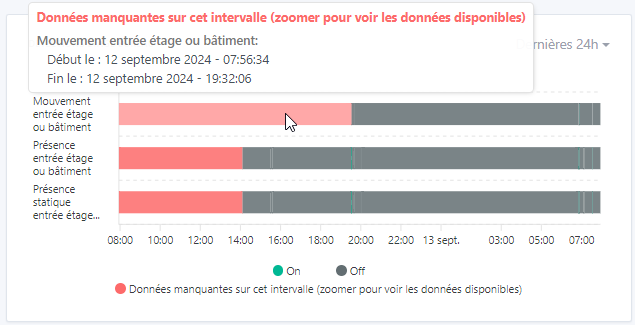
I would therefore like to implement (for testing) a completion, beyond 300 values, of the curve with a « buffer » area indicating the missing data allowing a zoom to visualize this timeline and not preventing the other features of the box — which would contain fewer data to be viewed:
PS OT: With all these tests, it also makes me think it’s a shame to show this view when we haven’t received a new state, whereas in fact we are still in a state until we’re sure it’s not a connection issue: