Very surprising ^^ after that I amuse myself by zooming in/out + with the inspector window enlarging/shrinking more finely to test all cases. I don’t know if you do the same!
It still bothers me that at some point it might break depending on a dimension…
In any case I’ll push the 1280 change and you can tell me.
Do we need to make this change for the dashboard as well? Even if there’s no issue there?
I had found the same articles!! But unlike you, I’m less organized… and I’m convinced I tested it, but it’s very likely that I had other changes in progress that were breaking things.
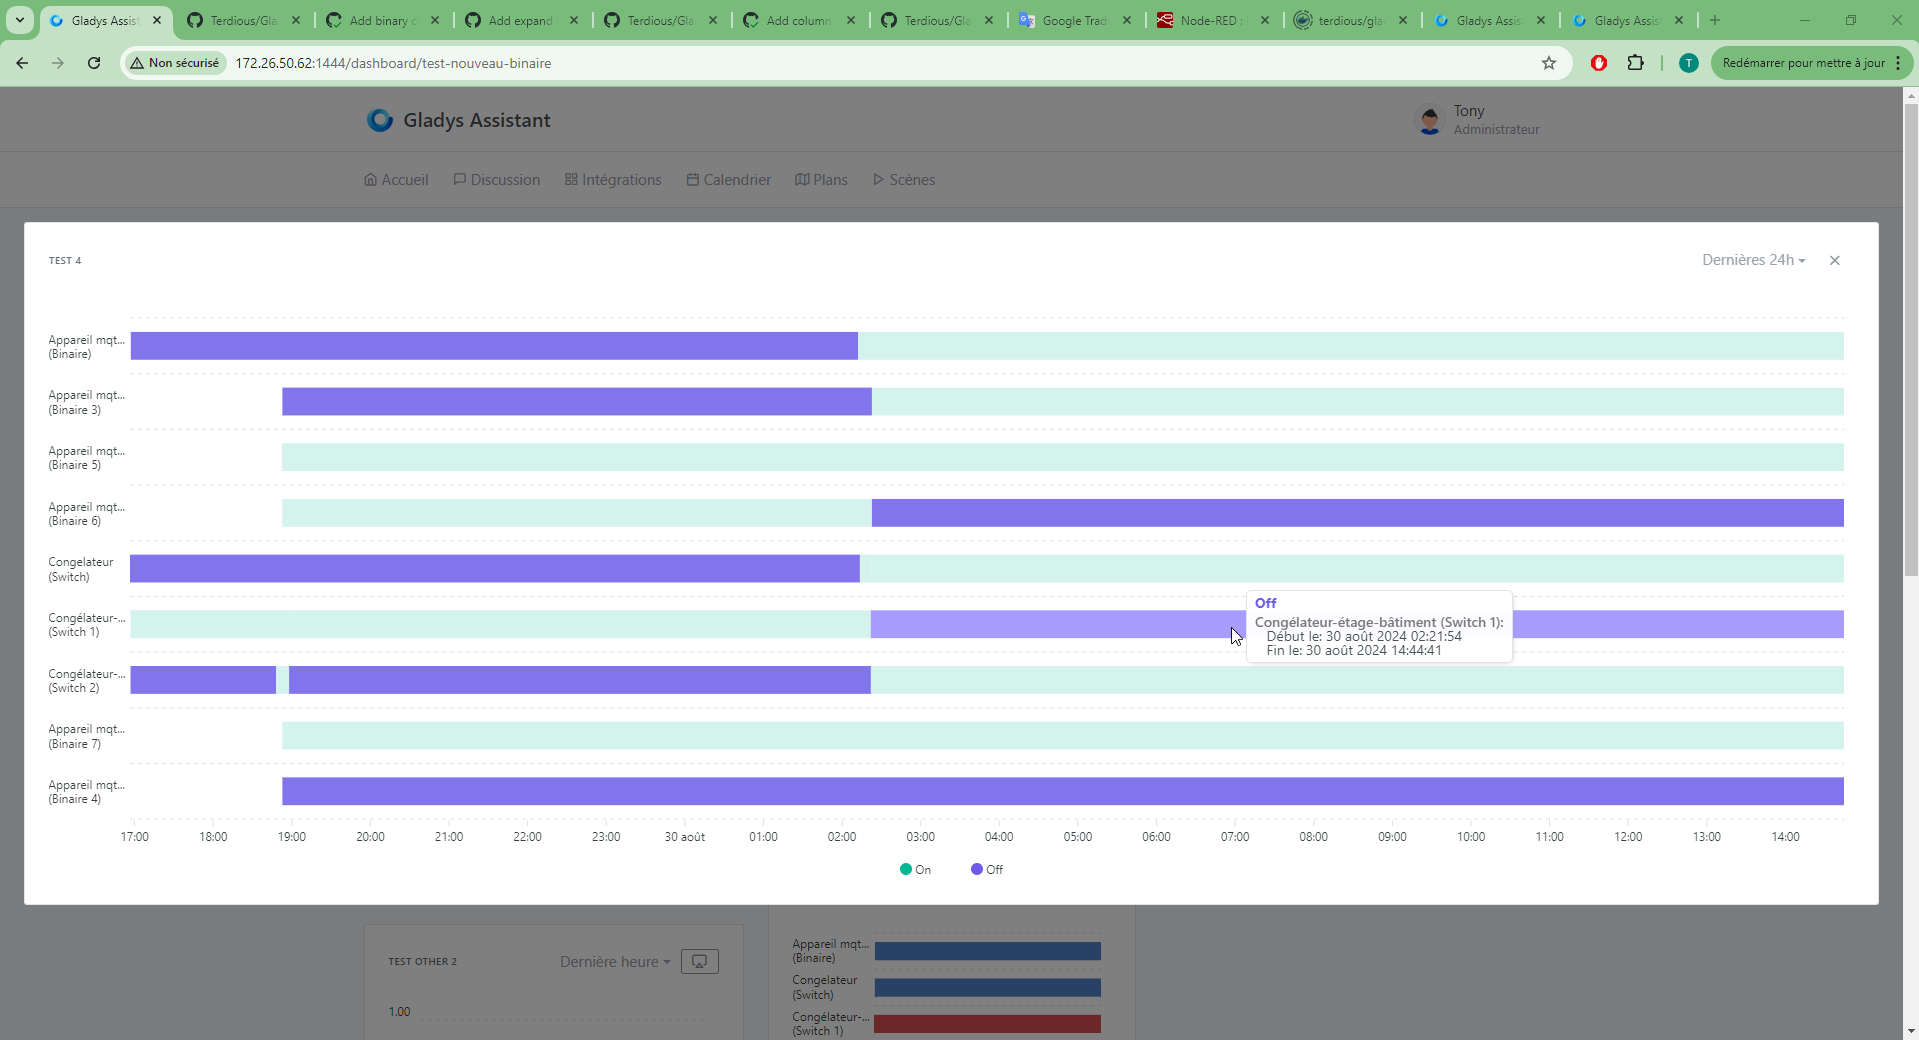
Heads up — this PR doesn’t include the live data view when zoomed if the displayed curve is 24h or longer.
I’m saying this just in case ^^ because it seemed
Yes, I understood that, but I’m still impatient nonetheless. Actually, I think the chart display section mainly needed the ability to show them larger, and now it’s perfect for me!
Between that and the binary sensors, I’m delighted with these latest developers!!
Here is, in my opinion, the comparison of the two solutions:
Page
Modal
Respects browser or mobile navigation (back button works)
Keeps the context when leaving the chart to return to the dashboard
Can be bookmarked, or shared via link
More pleasant for large charts, no risk of leaving the chart by clicking outside the modal
More pleasant on mobile? (Modal rarely used on mobile)
I looked at two pieces of software that do this kind of thing: Metabase and Grafana. Neither seems to use a modal; they navigate to a new page on click.
Wouldn’t a new page be in line with where we want to go? This page would allow adding all the improvements you mention (CSV export, etc…)
You can build your own dashboard with your charts, and you can click on a chart to open it in a larger view on a page and perform more complex operations:
I think this is close to what we want for Gladys in the future.