Box display bug - response timeout from local instance via Gladys Plus

I’ve recently been experiencing 2 issues.

The first:
My Gladys shuts down and doesn’t restart properly; I can’t connect to Gladys. Also, when I notice it and I’m not on site, I don’t know if it’s due to a network outage (not power, since the oven didn’t reset) or an internal bug.
I don’t know if I can view the logs after a reboot; I haven’t tried.

The second:

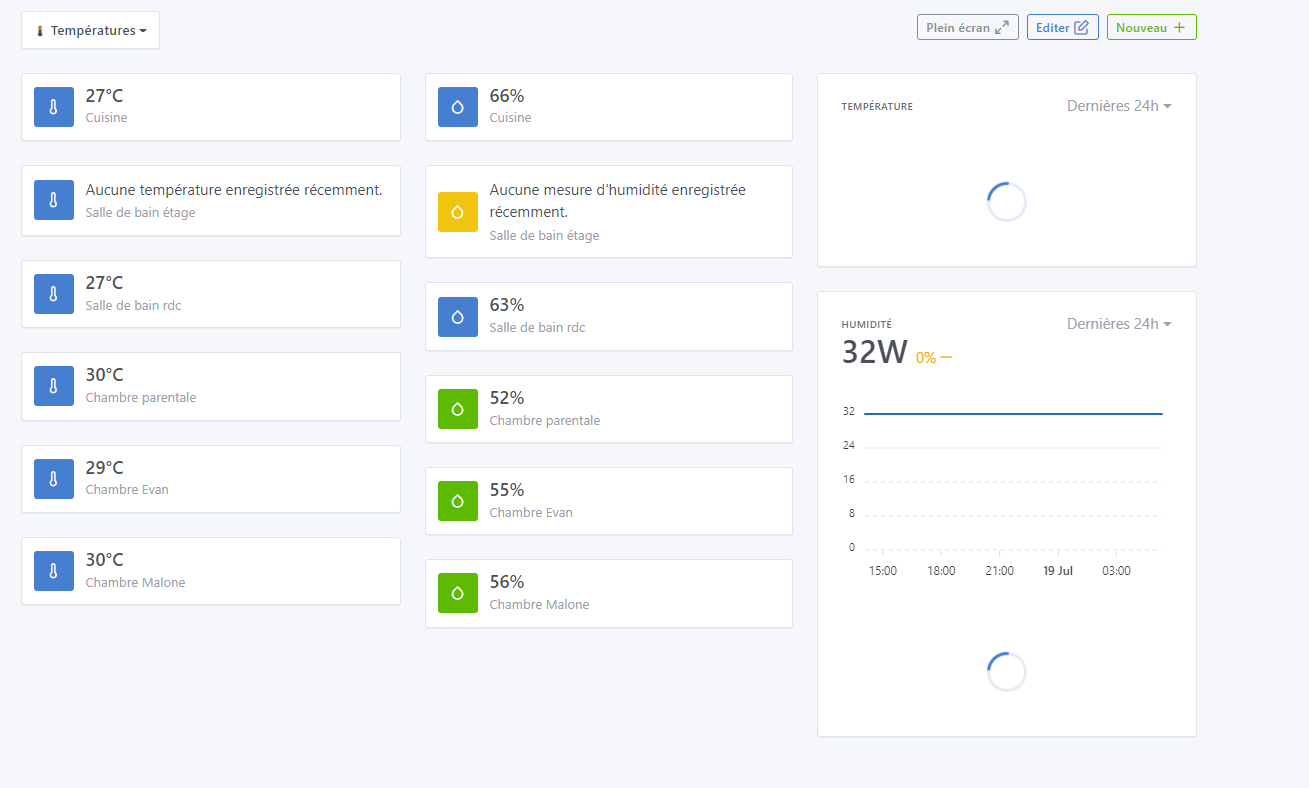
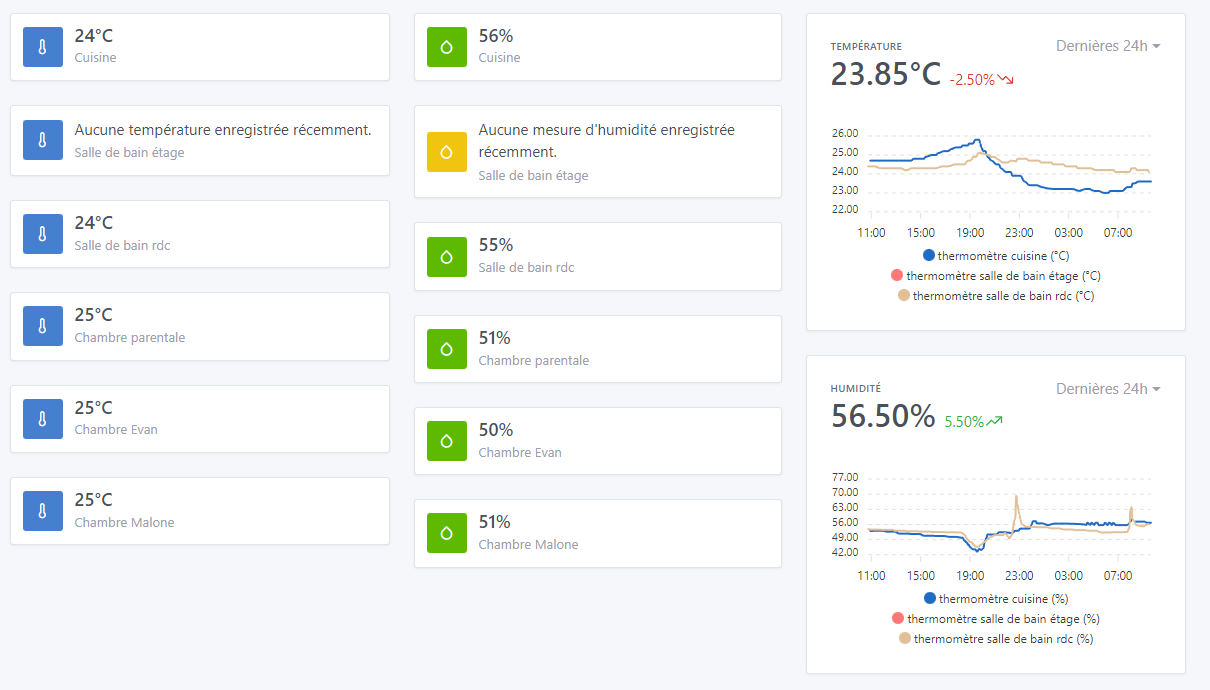
  • The temperature graphs don’t refresh when I select my Temperature tab.
    I have to refresh the tab a second or even a third time to get the correct display.
  • The humidity box shows the box that is on my main tab, i.e. a connected outlet that is no longer connected at the moment.

I think I’ve had this problem since the bathroom temperature sensor started acting up with the connection (it’s not the battery because I just checked on the zigbee2mqtt dashboard), but I’ll replace it to be sure.
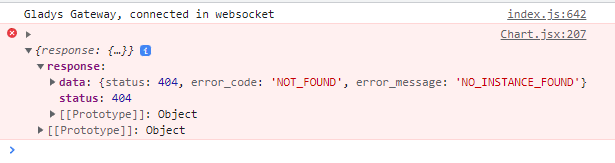
The box tries to display values that don’t exist and keeps spinning.

Hello @Tlse-vins !

For the first one, did you check the Gladys logs? Did you check what was happening on your hardware?

Do you have any errors in the browser logs?

First click:

After the second refresh, I no longer see the message.

Your local instance is having problems contacting Gladys Plus.

In my opinion there is an issue with your machine, a hardware issue for example

Can you confirm:
I’ll check the disk status with the command:

df

and the CPU usage at that time with the command:

cat/proc/loadavg

Yes for df

Otherwise, I recommend htop to monitor CPU/RAM usage / load average:

htop

If it’s not installed, you can install it with apt-get install

Same here today, no instance.

I’ll check when I get home tonight

1 Like

Here is the output from my end.
I see that the swap partition is full, could that be the cause?

For the df command, my hard disk is at 6%

You have 600Mb of RAM available so I don’t think so, but I see you only have 1 day of uptime — did you do that reboot or did your Pi reboot by itself?

And the Gladys logs, anything unusual?

Anything else running on this Pi besides Gladys?

Hi,

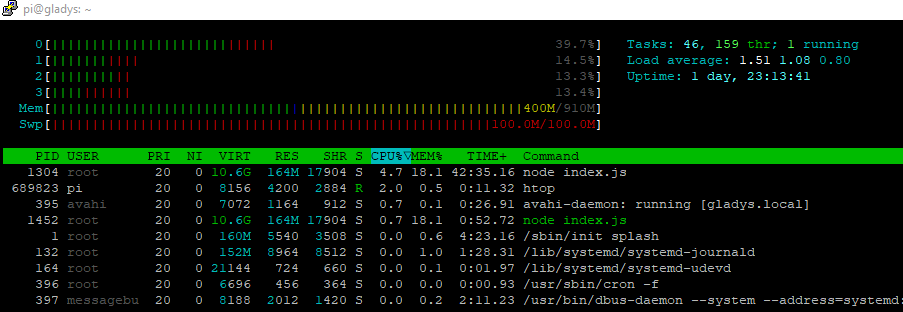
No, it wasn’t me who did the reboots of my Raspberry Pi, I don’t know why it crashed.
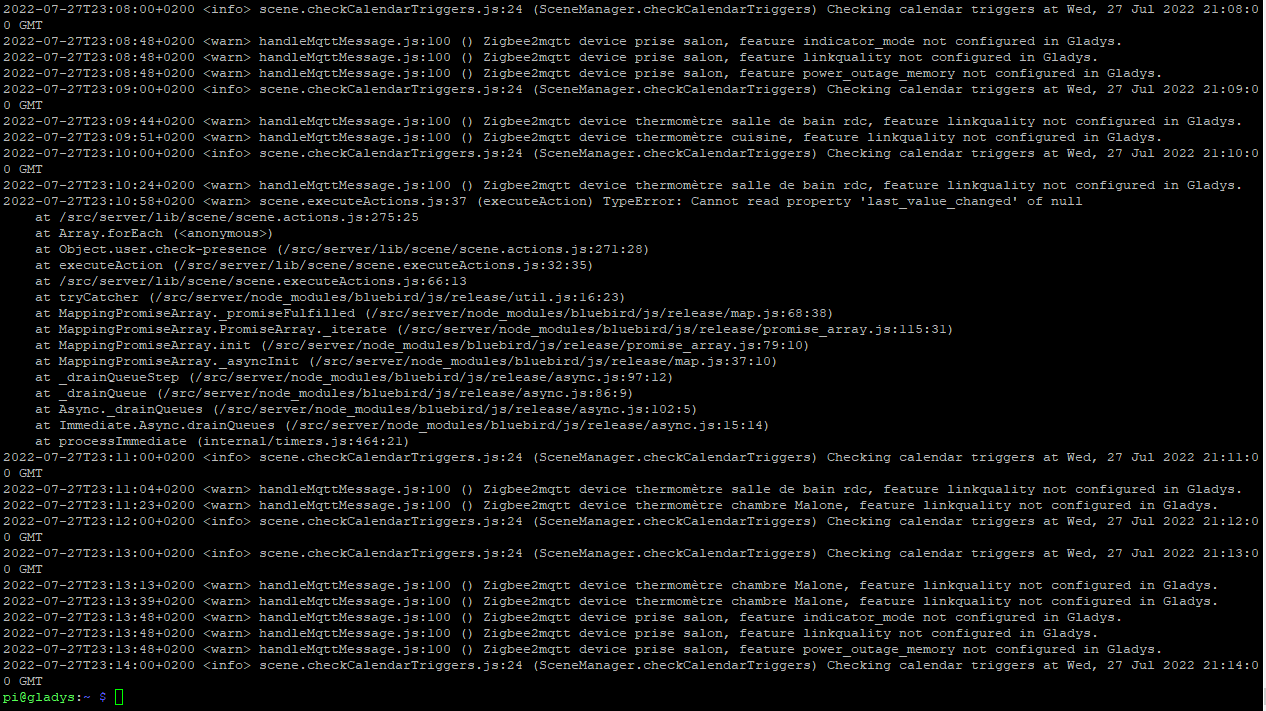
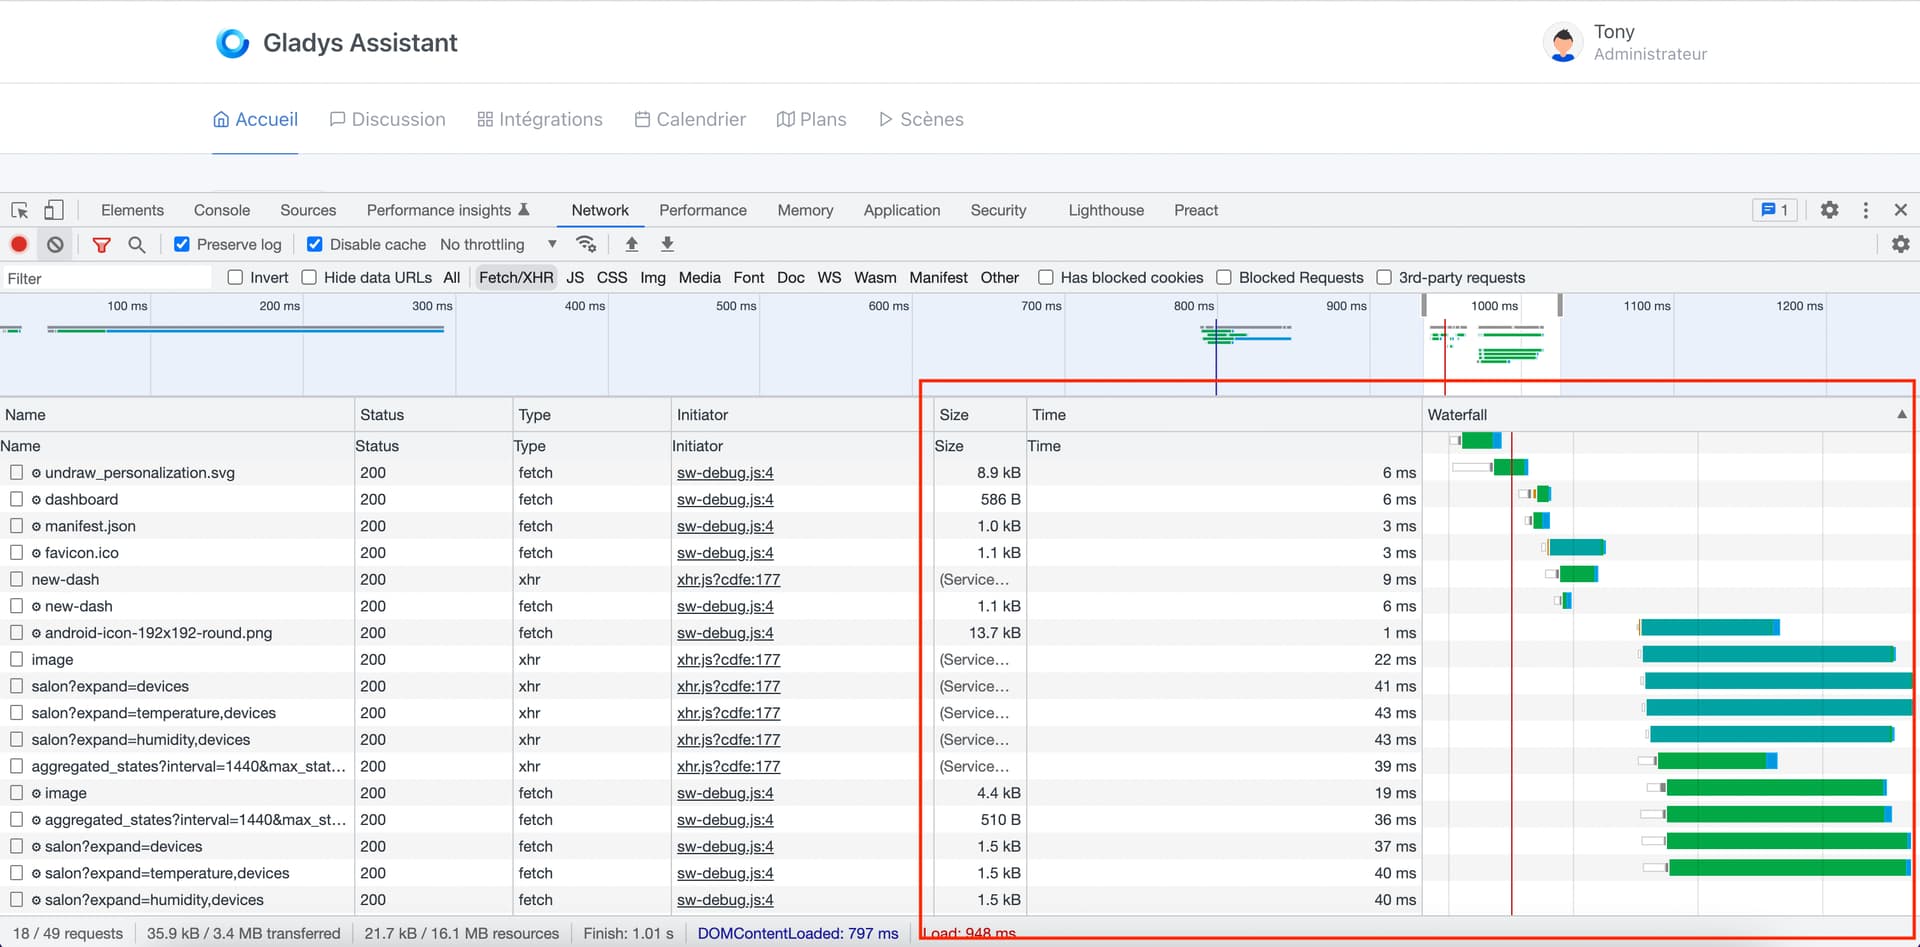
For the logs, I have a lot of warn and info entries. Apart from that, nothing in particular.

No, I just installed Node-RED in Docker but I’m not using it for now in Gladys.

Ok! Hard to say, so it’s hard to know if everything’s okay ^^

Are you still having the problem or is it better?

I just tested and it’s the same.
Had to refresh the tab twice.

edit:
I think it’s coming from the graph — there are 3 temperatures in one and 3 humidity percentages in the other.

On another tab where I only have the temperature, I don’t have this problem.
Has anyone else encountered this problem when displaying multiple data on the same graph?

And locally, is everything okay? (on your local network)

Can you take a screenshot of the size/speed of the requests locally:

I’ll take a look at that tonight, if I can.

@Tlse-vins Could you re-display that page, I added error logs on Gladys Plus to better understand why your instance is not properly connected :slight_smile:

OK I did several refreshes but I didn’t have the problem.

Ah! :joy: In a way, that’s for the best, aha

As soon as you have the issue again, tell me here when it happened :slight_smile:

ok that works.
Yes but we’d need to understand.

1 Like

It’s 11:42.

No luck, a small issue in the logs I had added, I didn’t notice anything :smiley:

I’ve modified the logs, as soon as you see the issue again let me know :wink: