The graphs do not seem to account for the timezone set in Gladys, which causes a time difference in the data (1 hour for the Paris timezone)
So, I don’t know where this is coming from. If I take into account this graph of my phone battery, I would have left at 08:00 and returned at 11:55.
The corresponding records from the t_device_feature_state table are as follows:
The time on my Raspberry Pi is correct:
![]()
And the timezone configuration in Gladys is set to GMT+1

So, I don’t see what is causing this one-hour offset ![]()
Interesting @Tolkyen! Out of curiosity, where do your values come from in terms of integration?
Indeed, it seems there is a one-hour offset.
Could you open your browser’s console on the dashboard, refresh and check the request GET YOUR_IP/api/v1/device_feature/aggregated_states?
And share the JSON response here ![]()
I want to see if it’s a server-side issue or a front-end display problem
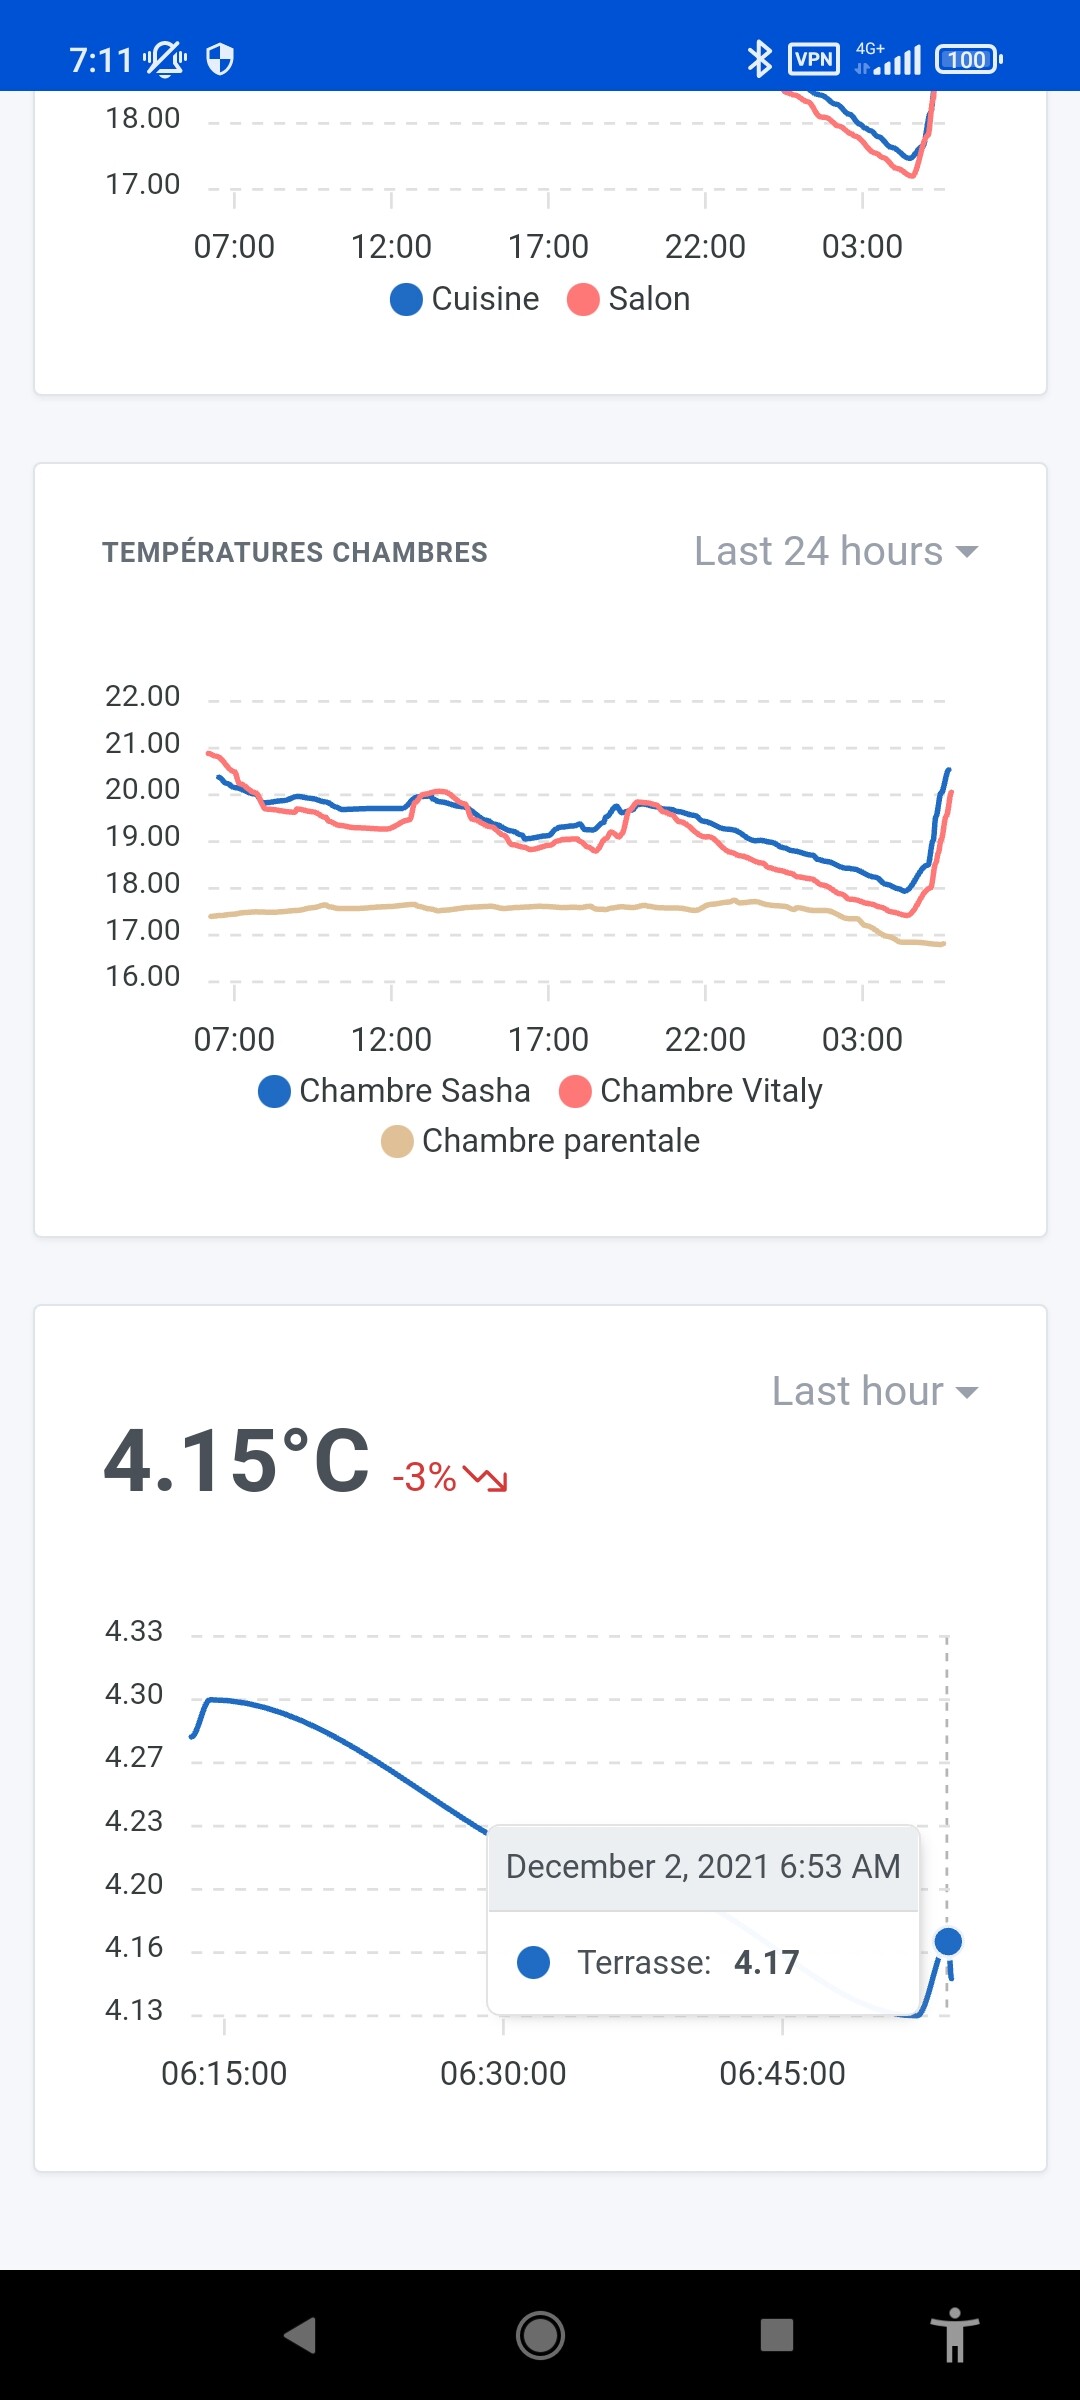
I use the Presence Publisher application for the battery value of my phone and my presence.
Here is the JSON following the GET request http://MY_IP/api/v1/device_feature/aggregated_states?interval=1440&max_states=100&device_features=mqtt-galaxynote9-battery
[HTTP/1.1 200 OK 86ms]
[{« device »:{« name »:« GalaxyNote9 »},« deviceFeature »:{« name »:« Galaxy Note 9 Battery »},« values »:[{« created_at »:« 2021-12-02T17:10:00.000Z »,« value »:54},{« created_at »:« 2021-12-02T17:25:00.000Z »,« value »:53},{« created_at »:« 2021-12-02T17:40:00.000Z »,« value »:52},{« created_at »:« 2021-12-02T17:55:00.000Z »,« value »:52},{« created_at »:« 2021-12-02T18:10:00.000Z »,« value »:48},{« created_at »:« 2021-12-02T18:25:00.000Z »,« value »:47},{« created_at »:« 2021-12-02T18:40:00.000Z »,« value »:46},{« created_at »:« 2021-12-02T18:55:00.000Z »,« value »:44},{« created_at »:« 2021-12-02T19:10:00.000Z »,« value »:42},{« created_at »:« 2021-12-02T19:25:00.000Z »,« value »:41},{« created_at »:« 2021-12-02T19:45:00.000Z »,« value »:40},{« created_at »:« 2021-12-02T20:00:00.000Z »,« value »:40},{« created_at »:« 2021-12-02T20:15:00.000Z »,« value »:39},{« created_at »:« 2021-12-02T20:30:00.000Z »,« value »:39},{« created_at »:« 2021-12-02T20:45:00.000Z »,« value »:38},{« created_at »:« 2021-12-02T21:00:00.000Z »,« value »:37},{« created_at »:« 2021-12-02T21:15:00.000Z »,« value »:37},{« created_at »:« 2021-12-02T21:30:00.000Z »,« value »:37},{« created_at »:« 2021-12-02T21:45:00.000Z »,« value »:36},{« created_at »:« 2021-12-02T22:05:00.000Z »,« value »:34},{« created_at »:« 2021-12-02T22:25:00.000Z »,« value »:34},{« created_at »:« 2021-12-02T22:40:00.000Z »,« value »:34},{« created_at »:« 2021-12-02T22:55:00.000Z »,« value »:35},{« created_at »:« 2021-12-02T23:10:00.000Z »,« value »:45},{« created_at »:« 2021-12-02T23:25:00.000Z »,« value »:55},{« created_at »:« 2021-12-02T23:40:00.000Z »,« value »:74},{« created_at »:« 2021-12-02T23:55:00.000Z »,« value »:84},{« created_at »:« 2021-12-03T00:10:00.000Z »,« value »:92},{« created_at »:« 2021-12-03T00:25:00.000Z »,« value »:100},{« created_at »:« 2021-12-03T00:40:00.000Z »,« value »:100},{« created_at »:« 2021-12-03T00:55:00.000Z »,« value »:100},{« created_at »:« 2021-12-03T01:10:00.000Z »,« value »:100},{« created_at »:« 2021-12-03T01:30:00.000Z »,« value »:100},{« created_at »:« 2021-12-03T01:45:00.000Z »,« value »:100},{« created_at »:« 2021-12-03T02:00:00.000Z »,« value »:100},{« created_at »:« 2021-12-03T02:15:00.000Z »,« value »:100},{« created_at »:« 2021-12-03T02:30:00.000Z »,« value »:100},{« created_at »:« 2021-12-03T02:45:00.000Z »,« value »:100},{« created_at »:« 2021-12-03T03:00:00.000Z »,« value »:100},{« created_at »:« 2021-12-03T03:20:00.000Z »,« value »:100},{« created_at »:« 2021-12-03T03:35:00.000Z »,« value »:100},{« created_at »:« 2021-12-03T03:50:00.000Z »,« value »:100},{« created_at »:« 2021-12-03T04:05:00.000Z »,« value »:100},{« created_at »:« 2021-12-03T04:20:00.000Z »,« value »:100},{« created_at »:« 2021-12-03T04:40:00.000Z »,« value »:100},{« created_at »:« 2021-12-03T04:55:00.000Z »,« value »:100},{« created_at »:« 2021-12-03T05:10:00.000Z »,« value »:100},{« created_at »:« 2021-12-03T05:25:00.000Z »,« value »:100},{« created_at »:« 2021-12-03T05:40:00.000Z »,« value »:100},{« created_at »:« 2021-12-03T05:55:00.000Z »,« value »:100},{« created_at »:« 2021-12-03T06:10:00.000Z »,« value »:97},{« created_at »:« 2021-12-03T06:25:00.000Z »,« value »:93},{« created_at »:« 2021-12-03T06:40:00.000Z »,« value »:91}]}]
Could you show me the DB values that go with them? Or just tell me if these values are correct or not?
Actually, I want to compare if these values returned by the API are correct or already wrong, to see if the issue comes from the backend or the frontend ![]()
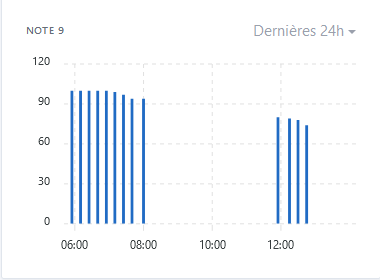
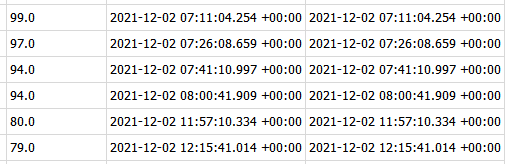
Here are the corresponding DB values:
- table t_device_feature_state_aggregate
|54.0|2021-12-02 18:10:40.675 +00:00|
|53.0|2021-12-02 18:25:41.109 +00:00|
|52.0|2021-12-02 18:40:40.905 +00:00|
|52.0|2021-12-02 18:55:41.552 +00:00|
|48.0|2021-12-02 19:10:47.604 +00:00|
|47.0|2021-12-02 19:25:41.760 +00:00|
|46.0|2021-12-02 19:40:41.855 +00:00|
|44.0|2021-12-02 19:55:41.953 +00:00|
|42.0|2021-12-02 20:10:49.072 +00:00|
|41.0|2021-12-02 20:25:54.034 +00:00|
|40.0|2021-12-02 20:45:41.672 +00:00|
|40.0|2021-12-02 21:00:40.320 +00:00|
|39.0|2021-12-02 21:15:41.600 +00:00|
|39.0|2021-12-02 21:30:41.297 +00:00|
|38.0|2021-12-02 21:45:41.712 +00:00|
|37.0|2021-12-02 22:00:42.655 +00:00|
|37.0|2021-12-02 22:15:41.565 +00:00|
|37.0|2021-12-02 22:30:41.205 +00:00|
|36.0|2021-12-02 22:45:43.283 +00:00|
|25.0|2021-12-01 23:08:30.201 +00:00|
|22.0|2021-12-01 23:23:31.792 +00:00|
|22.0|2021-12-01 23:40:40.647 +00:00|
|22.0|2021-12-01 23:56:07.923 +00:00|
|26.0|2021-12-02 00:08:41.407 +00:00|
|25.0|2021-12-02 00:23:46.843 +00:00|
|33.0|2021-12-02 00:40:40.587 +00:00|
|40.0|2021-12-02 00:55:41.045 +00:00|
|42.0|2021-12-02 01:02:26.640 +00:00|
|42.0|2021-12-02 01:02:52.282 +00:00|
|42.0|2021-12-02 01:17:52.988 +00:00|
|50.0|2021-12-02 01:35:40.807 +00:00|
|65.0|2021-12-02 01:51:04.835 +00:00|
|80.0|2021-12-02 02:06:05.795 +00:00|
|89.0|2021-12-02 02:22:09.764 +00:00|
|96.0|2021-12-02 02:37:13.891 +00:00|
|100.0|2021-12-02 02:52:15.646 +00:00|
|100.0|2021-12-02 03:07:19.726 +00:00|
|100.0|2021-12-02 03:22:23.787 +00:00|
|100.0|2021-12-02 03:37:27.571 +00:00|
|100.0|2021-12-02 03:52:30.694 +00:00|
|100.0|2021-12-02 04:07:31.926 +00:00|
|100.0|2021-12-02 04:22:37.040 +00:00|
|100.0|2021-12-02 04:37:39.550 +00:00|
|100.0|2021-12-02 04:52:40.525 +00:00|
|100.0|2021-12-02 05:07:41.597 +00:00|
|100.0|2021-12-02 05:22:42.267 +00:00|
|100.0|2021-12-02 05:39:05.699 +00:00|
|100.0|2021-12-02 05:55:17.492 +00:00|
|100.0|2021-12-02 06:10:28.649 +00:00|
|100.0|2021-12-02 06:25:40.858 +00:00|
|100.0|2021-12-02 06:40:45.551 +00:00|
|100.0|2021-12-02 06:55:47.611 +00:00|
|99.0|2021-12-02 07:11:04.254 +00:00|
|97.0|2021-12-02 07:26:08.659 +00:00|
|94.0|2021-12-02 07:41:10.997 +00:00|
|94.0|2021-12-02 08:00:41.909 +00:00|
|80.0|2021-12-02 11:57:10.334 +00:00|
|79.0|2021-12-02 12:15:41.014 +00:00|
|78.0|2021-12-02 12:30:42.156 +00:00|
|74.0|2021-12-02 12:45:41.144 +00:00|
|54.0|2021-12-02 18:10:40.675 +00:00|
|53.0|2021-12-02 18:25:41.109 +00:00|
|52.0|2021-12-02 18:40:40.905 +00:00|
|52.0|2021-12-02 18:55:41.552 +00:00|
|48.0|2021-12-02 19:10:47.604 +00:00|
|47.0|2021-12-02 19:25:41.760 +00:00|
|46.0|2021-12-02 19:40:41.855 +00:00|
|44.0|2021-12-02 19:55:41.953 +00:00|
|42.0|2021-12-02 20:10:49.072 +00:00|
|41.0|2021-12-02 20:25:54.034 +00:00|
|40.0|2021-12-02 20:45:41.672 +00:00|
|40.0|2021-12-02 21:00:40.320 +00:00|
|39.0|2021-12-02 21:15:41.600 +00:00|
|39.0|2021-12-02 21:30:41.297 +00:00|
|38.0|2021-12-02 21:45:41.712 +00:00|
|37.0|2021-12-02 22:00:42.655 +00:00|
|37.0|2021-12-02 22:15:41.565 +00:00|
|37.0|2021-12-02 22:30:41.205 +00:00|
|36.0|2021-12-02 22:45:43.283 +00:00|
|34.0|2021-12-02 23:07:53.886 +00:00|
|34.0|2021-12-02 23:25:41.196 +00:00|
|34.0|2021-12-02 23:40:40.659 +00:00|
|35.0|2021-12-02 23:55:41.747 +00:00|
|45.0|2021-12-03 00:10:44.620 +00:00|
|55.0|2021-12-03 00:25:45.664 +00:00|
|74.0|2021-12-03 00:40:53.666 +00:00|
|84.0|2021-12-03 00:56:02.976 +00:00|
|92.0|2021-12-03 01:11:04.401 +00:00|
|100.0|2021-12-03 01:26:08.855 +00:00|
|100.0|2021-12-03 01:43:03.981 +00:00|
|100.0|2021-12-03 01:59:05.630 +00:00|
|100.0|2021-12-03 02:14:10.224 +00:00|
|100.0|2021-12-03 02:31:09.721 +00:00|
|100.0|2021-12-03 02:46:11.790 +00:00|
|100.0|2021-12-03 03:01:16.744 +00:00|
|100.0|2021-12-03 03:16:22.653 +00:00|
|100.0|2021-12-03 03:31:28.816 +00:00|
|100.0|2021-12-03 03:48:06.341 +00:00|
|100.0|2021-12-03 04:04:56.066 +00:00|
|100.0|2021-12-03 04:20:09.611 +00:00|
|100.0|2021-12-03 04:39:11.196 +00:00|
|100.0|2021-12-03 04:54:26.893 +00:00|
|100.0|2021-12-03 05:09:29.539 +00:00|
|100.0|2021-12-03 05:24:38.653 +00:00|
|100.0|2021-12-03 05:40:40.061 +00:00|
|100.0|2021-12-03 05:55:44.694 +00:00|
|100.0|2021-12-03 06:11:17.572 +00:00|
|100.0|2021-12-03 06:26:22.620 +00:00|
|100.0|2021-12-03 06:41:26.797 +00:00|
|100.0|2021-12-03 06:56:30.470 +00:00|
|97.0|2021-12-03 07:11:33.062 +00:00|
|93.0|2021-12-03 07:26:55.649 +00:00|
|91.0|2021-12-03 07:42:05.299 +00:00|
- table t_device_feature_state
|54.0|2021-12-02 18:10:40.675 +00:00|
|53.0|2021-12-02 18:25:41.109 +00:00|
|52.0|2021-12-02 18:40:40.905 +00:00|
|52.0|2021-12-02 18:55:41.552 +00:00|
|48.0|2021-12-02 19:10:47.604 +00:00|
|47.0|2021-12-02 19:25:41.760 +00:00|
|46.0|2021-12-02 19:40:41.855 +00:00|
|44.0|2021-12-02 19:55:41.953 +00:00|
|42.0|2021-12-02 20:10:49.072 +00:00|
|41.0|2021-12-02 20:25:54.034 +00:00|
|40.0|2021-12-02 20:45:41.672 +00:00|
|40.0|2021-12-02 21:00:40.320 +00:00|
|39.0|2021-12-02 21:15:41.600 +00:00|
|39.0|2021-12-02 21:30:41.297 +00:00|
|38.0|2021-12-02 21:45:41.712 +00:00|
|37.0|2021-12-02 22:00:42.655 +00:00|
|37.0|2021-12-02 22:15:41.565 +00:00|
|37.0|2021-12-02 22:30:41.205 +00:00|
|36.0|2021-12-02 22:45:43.283 +00:00|
|34.0|2021-12-02 23:07:53.886 +00:00|
|34.0|2021-12-02 23:25:41.196 +00:00|
|34.0|2021-12-02 23:40:40.659 +00:00|
|35.0|2021-12-02 23:55:41.747 +00:00|
|45.0|2021-12-03 00:10:44.620 +00:00|
|55.0|2021-12-03 00:25:45.664 +00:00|
|74.0|2021-12-03 00:40:53.666 +00:00|
|84.0|2021-12-03 00:56:02.976 +00:00|
|92.0|2021-12-03 01:11:04.401 +00:00|
|100.0|2021-12-03 01:26:08.855 +00:00|
|100.0|2021-12-03 01:43:03.981 +00:00|
|100.0|2021-12-03 01:59:05.630 +00:00|
|100.0|2021-12-03 02:14:10.224 +00:00|
|100.0|2021-12-03 02:31:09.721 +00:00|
|100.0|2021-12-03 02:46:11.790 +00:00|
|100.0|2021-12-03 03:01:16.744 +00:00|
|100.0|2021-12-03 03:16:22.653 +00:00|
|100.0|2021-12-03 03:31:28.816 +00:00|
|100.0|2021-12-03 03:48:06.341 +00:00|
|100.0|2021-12-03 04:04:56.066 +00:00|
|100.0|2021-12-03 04:20:09.611 +00:00|
|100.0|2021-12-03 04:39:11.196 +00:00|
|100.0|2021-12-03 04:54:26.893 +00:00|
|100.0|2021-12-03 05:09:29.539 +00:00|
|100.0|2021-12-03 05:24:38.653 +00:00|
|100.0|2021-12-03 05:40:40.061 +00:00|
|100.0|2021-12-03 05:55:44.694 +00:00|
|100.0|2021-12-03 06:11:17.572 +00:00|
|100.0|2021-12-03 06:26:22.620 +00:00|
|100.0|2021-12-03 06:41:26.797 +00:00|
|100.0|2021-12-03 06:56:30.470 +00:00|
|97.0|2021-12-03 07:11:33.062 +00:00|
|93.0|2021-12-03 07:26:55.649 +00:00|
|91.0|2021-12-03 07:42:05.299 +00:00|
It seems there is indeed a lag.
I have the same problem as you and I created a GitHub issue Graphs have between 1 hour and 2 hours delay · Issue #1430 · GladysAssistant/Gladys · GitHub
So it’s not a bug (yes, yes ^^), but just a technical choice I made following my observations (which may be re-challenged)
Each aggregation only calculates the aggregated values for the period preceding the current period.
For hourly aggregation, it only calculates the hours that are already completed.
For example, if it is 14:50, the hourly aggregation will only calculate up to the last hour « fully finished », i.e. up to 13:59:59.
In the UI, the front only displays the aggregated data, and therefore on the intervals that are in hours, there is a one-hour delay because the last hour is not yet aggregated.
On daily intervals, there is always a one-day delay.
I had done tests to make a query that makes a double query: aggregated + live data, but it didn’t look good at all visually because the live data was naturally more detailed than the aggregated data.
What we could eventually do is make a « hot » aggregation during the querying, but with a number of events pro-rated for the time spent on the current interval so that the data is at the same level of « detail » in the UI (otherwise it will be messy).
After that, this will be a heavier processing that could slow down the queries so we’ll see if it’s worth it, and I don’t think it will be as simple as that to have a clean rendering, I’m afraid we will see the separation between the aggregated data and the « live but hot aggregated data pro-rated »
For recent data, would it be possible to do a 24-hour « sliding » window but with a 5-minute interval? (meaning recalculating more frequently rather than on the fly)
It’s necessary to test if it renders well, but the rendering will inevitably be different and this can be seen in the curve
For a 24-hour view, we only keep 100 values. So 24*60 = 1440 minutes per day / 100 = one value every 14.4 minutes on average
The « on average » is very important, because the aggregation does not calculate fixed points (it’s not a point every 14 minutes), but tries to make 100 points whose curve is as close as possible to the curve with all the points.
Therefore, if we increase the frequency of the calculation interval for the last 24 hours, we do not have knowledge of the « general table » of the day, and we will inevitably produce a rendering different from a real 24-hour rendering.
After that, I agree that the current solution lacks these live data a bit on these intervals.
In short, it is necessary to code the thing and carry out different tests, with many different data sets, to see what works best visually.. ![]()
Indeed, in this case there might be a double issue, including a timezone issue
You could check in the DB in the tables t_device_feature_state & t_device_feature_state_aggregate, and compare with what you retrieve in the front end?
To see if the issue comes from the DB, the back end, or the front end?
In fact, everything is fine…
If I take a sensor that sends status updates very regularly:
- the last event was at 21:50
- the last hourly aggregation occurred at 21:20 (for data up to 21:00)
- the frontend graph shows data up to 21:00
My feeling of delay came from sensors that do not send status updates regularly (sometimes 1 status in 2 hours).
Great!
After the potentially improved operation, I agree, having a mix of live data + aggregated data in the UI would be cool.
In the initial development (which had already lasted 2 months if I remember correctly), I hadn’t managed to get it working cleanly as easily as that, and so I had set it aside.
If this is a recurring request, I can invest time in it, but I really don’t think it’s a simple development.