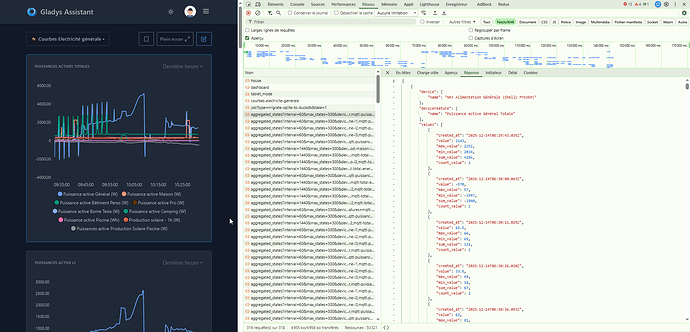
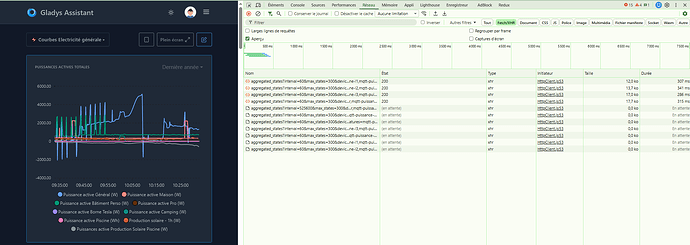
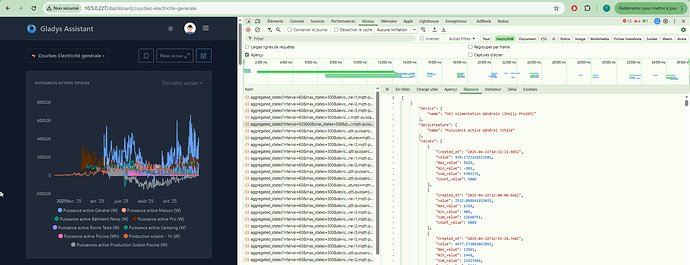
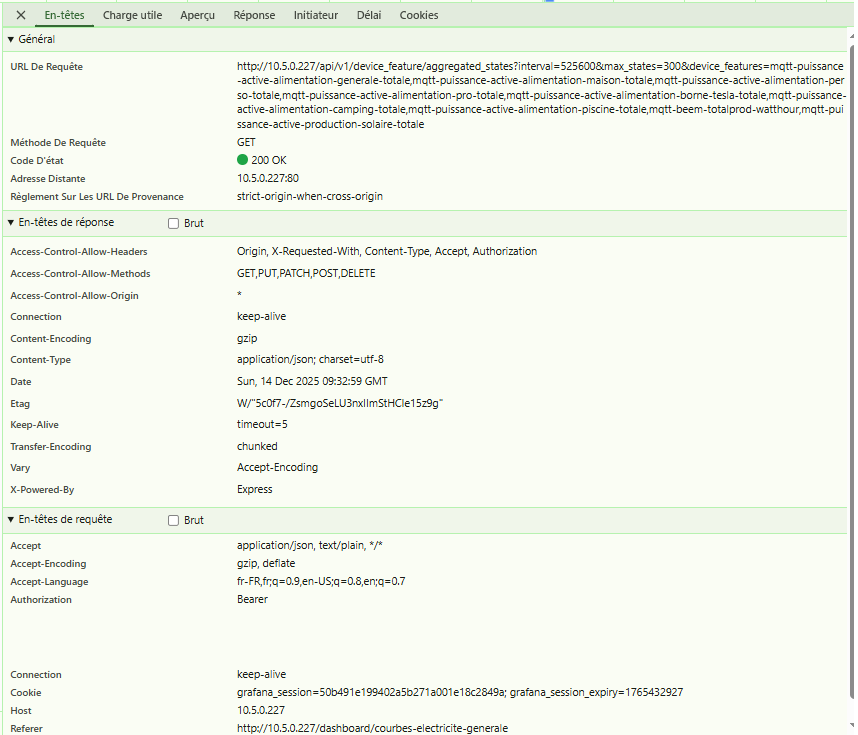
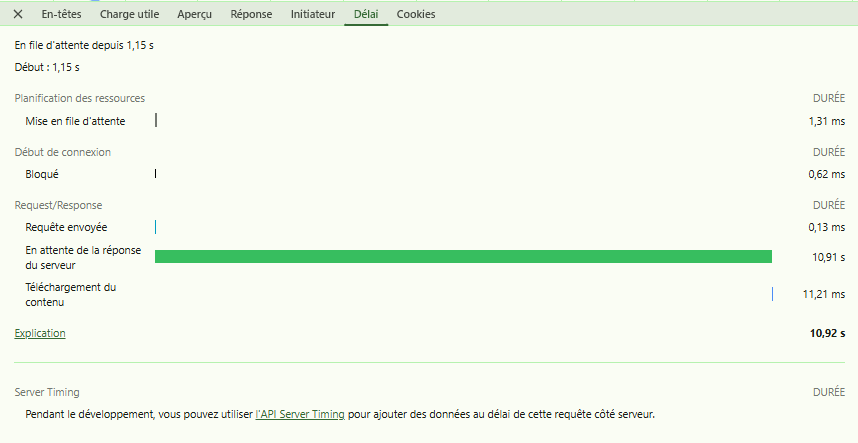
Well, I just ran some tests… And from that I would say that the problem is most likely not the queries to DuckDB (I believe we had already run this kind of tests directly in dev in Gladys ^^). It must simply be the rendering or rather the construction of the series… :
- Aggregation by time bucket - TimeBucket Query
SELECT
    device_feature_id,
    TIME_BUCKET(INTERVAL 1752 MINUTES, created_at) AS created_at,
    AVG(value) AS value,
    MAX(value) AS max_value,
    MIN(value) AS min_value,
    SUM(value) AS sum_value,
    COUNT(value) AS count_value
FROM t_device_feature_state
WHERE device_feature_id IN (
	'eaa982b7-a3c8-4b4d-b2d0-5a5cf5245938',
    'e9079170-4654-4fad-b726-23a36c793905',
    'c59fca37-54f3-418b-b27c-857e08e2a0fb',
    'da79df66-dcff-438e-859c-39b641fd15e9',
    '5eba10ac-4c3a-479c-aba7-a1e74a00d914',
    '4b5e90f0-a86b-405b-8ca1-953705ef79a3',
    'c92f8fa3-d841-4692-bd3a-e5addb760a73',
    'b5445f10-7aa9-41bf-8cae-d2f30498652f',
    '08e90478-4bb2-4a08-986f-3d6f212c95f1',
    '85311f8c-334f-4b7e-8294-2b841c0b8fe8'
)
AND created_at > TIMESTAMP '2024-12-14 10:04:11.478'
GROUP BY
    device_feature_id,
    created_at
ORDER BY
    device_feature_id,
    created_at;

- Partitioning by quantiles - NTILE(300) Query
WITH intervals AS (
    SELECT
        device_feature_id,
        created_at,
        value,
        NTILE(300) OVER (
            PARTITION BY device_feature_id
            ORDER BY created_at
        ) AS interval
    FROM t_device_feature_state
    WHERE device_feature_id IN (
		'eaa982b7-a3c8-4b4d-b2d0-5a5cf5245938',
	    'e9079170-4654-4fad-b726-23a36c793905',
	    'c59fca37-54f3-418b-b27c-857e08e2a0fb',
	    'da79df66-dcff-438e-859c-39b641fd15e9',
	    '5eba10ac-4c3a-479c-aba7-a1e74a00d914',
	    '4b5e90f0-a86b-405b-8ca1-953705ef79a3',
	    'c92f8fa3-d841-4692-bd3a-e5addb760a73',
	    'b5445f10-7aa9-41bf-8cae-d2f30498652f',
	    '08e90478-4bb2-4a08-986f-3d6f212c95f1',
	    '85311f8c-334f-4b7e-8294-2b841c0b8fe8'
    )
    AND created_at > TIMESTAMP '2024-12-14 10:04:11.478'
)
SELECT
    device_feature_id,
    MIN(created_at) AS created_at,
    AVG(value) AS value,
    MAX(value) AS max_value,
    MIN(value) AS min_value,
    SUM(value) AS sum_value,
    COUNT(value) AS count_value
FROM intervals
GROUP BY
    device_feature_id,
    interval
ORDER BY
    device_feature_id,
    created_at;

So I re-ran a performance test on the dashboard:

ChatGPT Study ^^ :
 Direct reading of your Performance recording
 Total duration
- Total ≈ 13,190 ms (13.2 s)
 Breakdown (left panel)
- Rendering (Affichage): 2,330 ms
- Paint / Layout (Rendu): 791 ms
- Script (JS): 563 ms
- Network loading (Chargement réseau): 27 ms
- System / unassigned (Système / non attribué): ~5,200 ms
- Total “useful” visible: ~4 s
- Big gap “unassigned / idle / waiting”: ~9 s
 Immediate conclusion:
 it’s neither the network,
 nor DuckDB,
 nor pure JavaScript,
 it’s mostly waiting time before the useful rendering starts.
 Focus on the Network part (key for Gladys)
In your table on the right:
- Request:
aggregated_states (10.5.0.227)
- Transferred size: 213 KB
- Execution time: ~260 ms
 That confirms what we suspected:
- the backend query is fast
- the payload is reasonable
- < 300 ms, so not the problem
 We can now say without ambiguity:
Chrome Performance measurements show that:
- the backend query is < 300 ms
- the payload is ~213 KB
- pure JS < 600 ms
The ~13 s experienced are mainly due to a waiting phase + front-end chart rendering.
Optimization should therefore be done mostly on the React / chart rendering pipeline, not on DuckDB.
 So where do the ~9 seconds go?
According to the flame chart and timeline:
 “Waiting / unassigned” phase (~9 s)
It’s typically:
- waiting for a complete React state
- waiting for all series to be ready
- synchronization before mounting the chart
- or logic like:
- “waiting for all promises”
- “waiting for X to be computed before rendering”
 Classic anti-pattern on complex dashboards.
 “Rendering + Layout” phase (~3 s)
Here, we are clearly seeing:
- many points
- many series
- probably:
- recalculation of scales
- recalculation of legends
- tooltips
- min/max
- animations
 This is consistent with an annual multi-curve graph.
 Conclusion (which you can already state)
You can already say, with evidence:
Chrome Performance measurements show that:
- the backend query is < 300 ms
- the payload is ~213 KB
- pure JS < 600 ms
The ~13 s experienced are mainly due to a waiting phase + front-end chart rendering.
Optimization should therefore be done mostly on the React / chart rendering pipeline, not on DuckDB.
 Next concrete steps (if you want to go further)
Without even seeing the code, the obvious levers are:
- render the chart progressively (series one by one)
- limit the number of points before rendering (hard cap)
- disable animations/transitions on long views
- virtualize / pure canvas if not already the case
