Ok! It’s a real bug then, I created an issue to keep track of the error:
If someone can reproduce it on their side and wants to propose a fix, I’d appreciate it!! ![]()
Ok! It’s a real bug then, I created an issue to keep track of the error:
If someone can reproduce it on their side and wants to propose a fix, I’d appreciate it!! ![]()
@pierre-gilles, To be sure, I checked with another sensor. For this example, an Aqara temperature and humidity sensor.
Here a humidity
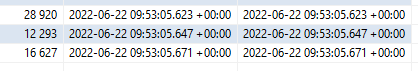
In the database the time zone is incorrect
That seemed correct for @pierre-gilles
Ah yes, exactly — it’s stored in UTC.
However, it’s returned with an incorrect datetime (-2h compared to the database)
A problem during aggregation?
In my opinion it’s more of a problem in the API route, but I haven’t been able to look yet ![]()
Hi, having the same issue on my instance, I started a fix
But before marking the PR as ready for review I’d like to understand why it works for some and not for others.
To explain, the saved date for the state to display is stored in UTC format (at least for @_Will_71 and me, both having this problem). But when we read this value in the aggregation retrieval API, we create a new date from that value; however the Date class seems to interpret it as a date in the machine’s timezone and then convert it back to UTC which causes a 2-hour shift (for the French time zone).
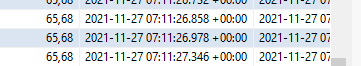
So first question: those whose graphs display the times correctly, can you tell me the format of the date of your aggregations in the database please?
That reassures me, I feel less alone with this problem.
I hadn’t seen it, but on my side there’s also a 2-hour difference.
I hadn’t noticed this difference before checking this morning.
I’m on G-plus and can’t check the DB.
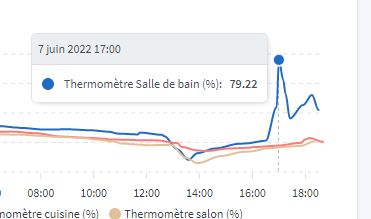
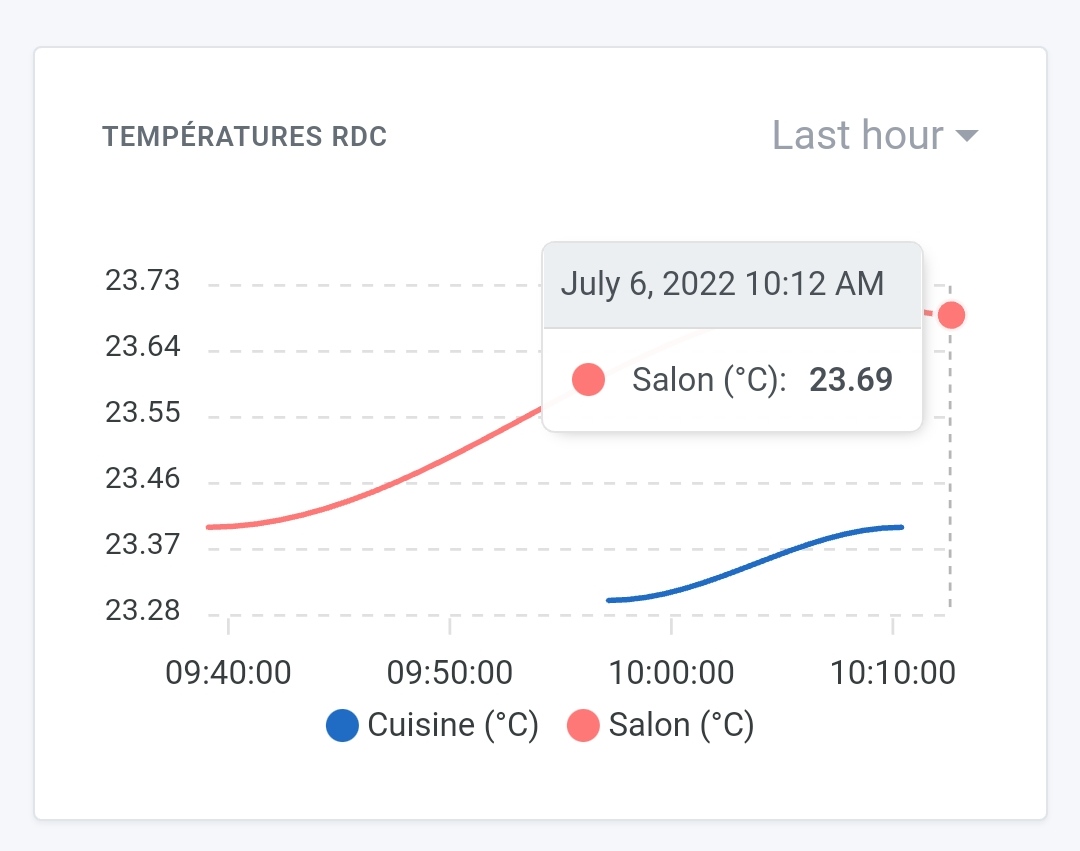
@VonOx can you check your graph with the 24-hour view.
I don’t have any issue for the last hour, but I do for the last 24 hours.
I confirm the 2-hour shift on the 24-hour graph
So for now everyone has the problem.
@Terdious you say it works for you; in your screenshots your graphs are on the last hour. Can you check what it looks like over 24h, please?
Do you want me to patch my prod to test your fix?
If you want to try, yes I’d be happy to, thanks, but I can create a dev image for you if that’s easier
I also confirm the 2-hour offset on the graphs of the last 24 hours!!^^
Ok thanks Thomas.
So the fix is ready, I’m starting to create a test image for anyone who wants one
I’ve patched, fix ok @bertrandda
Thanks Vincent, for everyone else a test Docker image is available bertrandda/gladys:fix-graph