Hi,
sorry if I’m not using the correct terms.
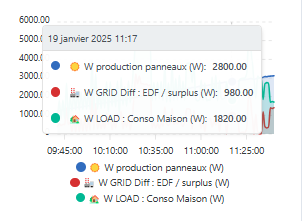
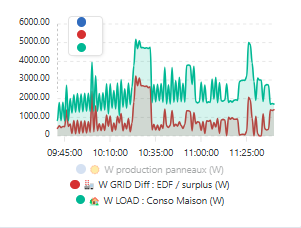
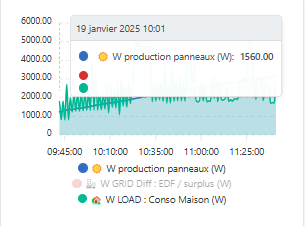
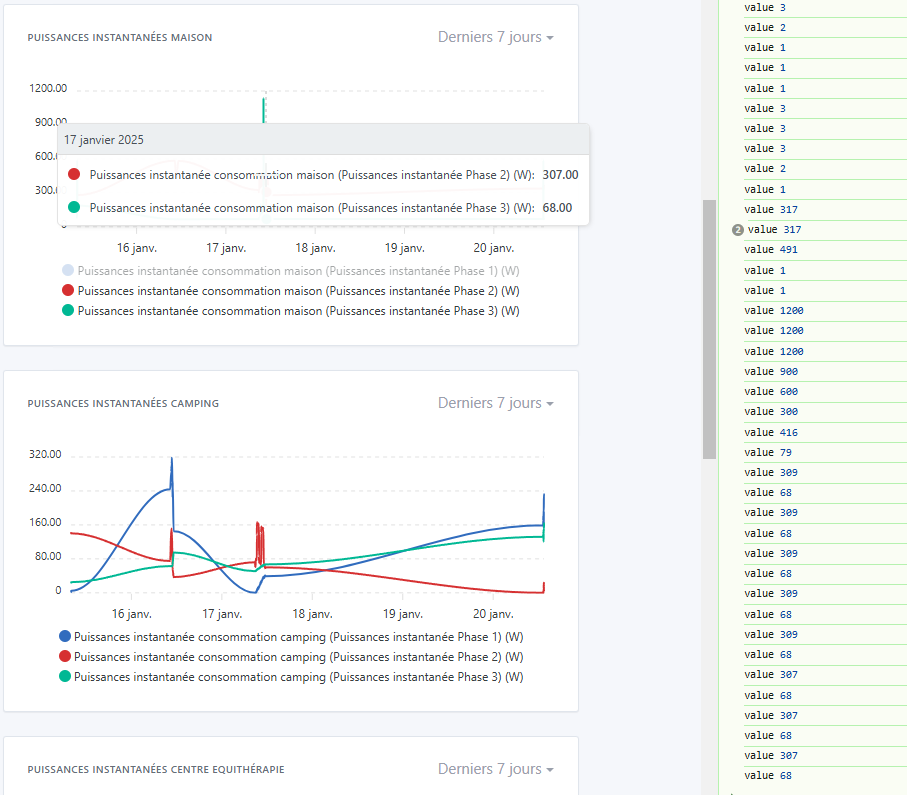
I have a chart in a dashboard tracking 3 data series. When I hover the cursor over it, I get the values at the cursor position for all three series. Depending on the value I uncheck by clicking on it below the chart, the values no longer appear at all or only partially. They come back a little when moving to the edges of the chart but not always.
I don’t know if this error has already been reported and if it’s easy to fix.
Yes, I’m indeed talking about the comments and values next to each bubble in the window that appears as an overlay on the chart.
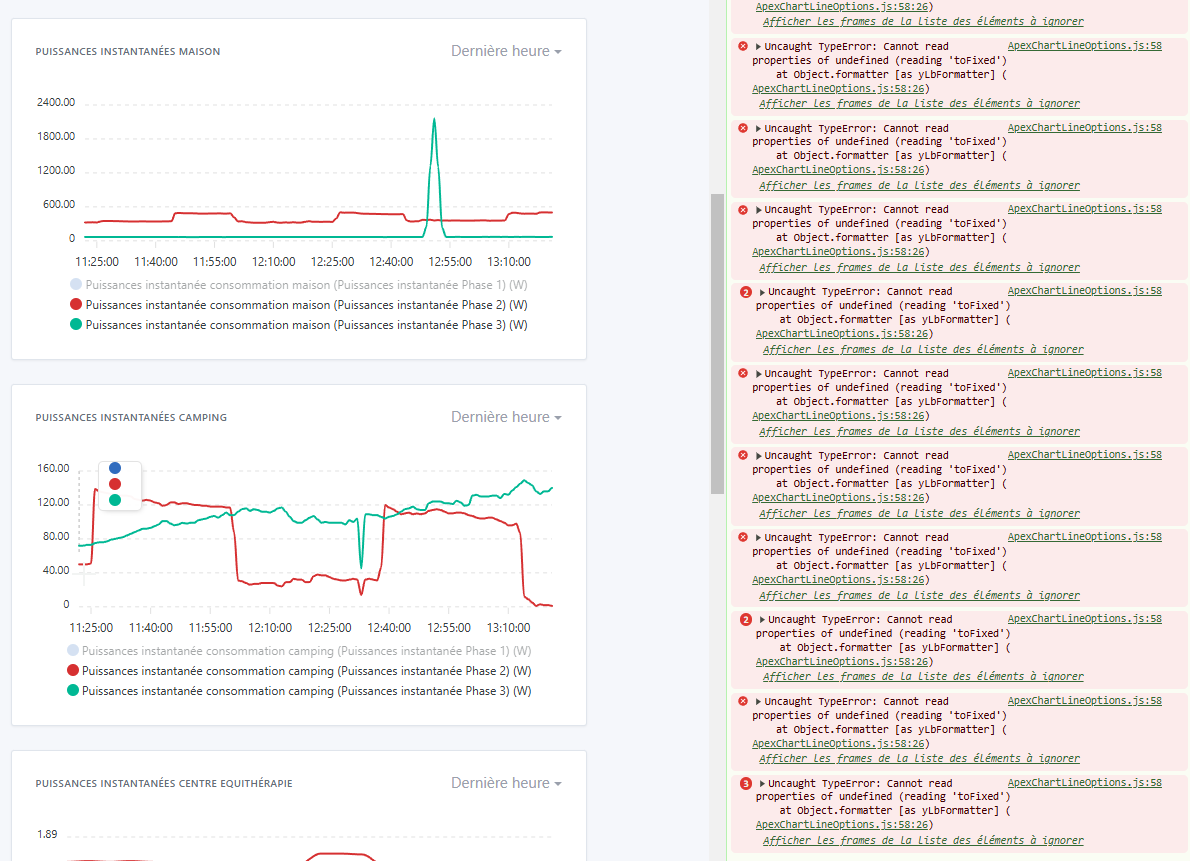
I have the same problem on every chart, even with only 2 values.
Well, in my defense, it obviously doesn’t come from my change ^^
It seems this part is what’s causing the issue:
        formatter: function(value) {
          if (Math.abs(value) \u003c 1) {
            return value; // For very low values, like crypto prices, use the normal value
          } else {
            console.log('value', value);
            return value.toFixed(2); // 2 decimal places for other values
          }
        }
      }
Because there was no condition for values that are not numbers. And when we want to hide a result, Apex still goes in there and sends a value=undefined => It breaks on .toFixed(2).
I just added a condition: if (Math.abs(value) \u003c 1 || isNaN(value)) if that works for you, I’ll send the PR @pierre-gilles.