Hello,
I’ve just noticed that my Gladys instance crashes regularly (at least twice a day).
On closer inspection, it seems to be related to excessive RAM usage. Gladys runs on a mini PC that has 8GB of RAM.
I have 5 cameras configured; could this be the same issue identified by @spenceur in 2023? Gladys utilisation de la ram
What’s strange is that the crashes have only been happening regularly for a few days, even though my setup (PC and Gladys configuration) hasn’t changed for months!
Am I the only one in this situation?
Here is the error message when it crashes:
\u003c--- JS stacktrace ---\u003e

FATAL ERROR: Reached heap limit Allocation failed - JavaScript heap out of memory
 1: 0xb9c1f0 node::Abort() [node]
 2: 0xaa27ee  [node]
 3: 0xd73950 v8::Utils::ReportOOMFailure(v8::internal::Isolate*, char const*, bool) [node]
 4: 0xd73cf7 v8::internal::V8::FatalProcessOutOfMemory(v8::internal::Isolate*, char const*, bool) [node]
 5: 0xf51075  [node]
 6: 0xf6354d v8::internal::Heap::CollectGarbage(v8::internal::AllocationSpace, v8::internal::GarbageCollectionReason, v8::GCCallbackFlags) [node]
 7: 0xfd2574 v8::internal::ScavengeJob::Task::RunInternal() [node]
 8: 0xe4304b non-virtual thunk to v8::internal::CancelableTask::Run() [node]
 9: 0xc07144  [node]
10: 0xc0a5ae node::PerIsolatePlatformData::FlushForegroundTasksInternal() [node]
11: 0x16754b6  [node]
12: 0x1687a24  [node]
13: 0x1675e1e uv_run [node]
14: 0xad9a4a node::SpinEventLoop(node::Environment*) [node]
15: 0xbe1844 node::NodeMainInstance::Run() [node]
16: 0xb54dc8 node::LoadSnapshotDataAndRun(node::SnapshotData const**, node::InitializationResult const*) [node]
17: 0xb58a2f node::Start(int, char**) [node]
18: 0x7faf5e36724a  [/lib/x86_64-linux-gnu/libc.so.6]
19: 0x7faf5e367305 __libc_start_main [/lib/x86_64-linux-gnu/libc.so.6]
20: 0xad789e _start [node]
Psoy
October 11, 2024, 6:36pm
2
I have the same problem: regular crashes
\u003c--- Last few GCs ---\u003e

[1:0x58618b0]  2738690 ms: Mark-sweep (reduce) 2039.6 (2083.8) -\u003e 2038.6 (2084.0) MB, 1065.5 / 0.0 ms  (average mu = 0.098, current mu = 0.005) allocation failure; scavenge might not succeed
[1:0x58618b0]  2739787 ms: Mark-sweep (reduce) 2039.7 (2084.0) -\u003e 2038.6 (2084.3) MB, 1092.4 / 0.0 ms  (average mu = 0.052, current mu = 0.004) allocation failure; scavenge might not succeed


\u003c--- JS stacktrace ---\u003e

FATAL ERROR: Ineffective mark-compacts near heap limit Allocation failed - JavaScript heap out of memory
 1: 0xb9c1f0 node::Abort() [node]
 2: 0xaa27ee  [node]
 3: 0xd73950 v8::Utils::ReportOOMFailure(v8::internal::Isolate*, char const*, bool) [node]
 4: 0xd73cf7 v8::internal::V8::FatalProcessOutOfMemory(v8::internal::Isolate*, char const*, bool) [node]
 5: 0xf51075  [node]
 6: 0xf51f78 v8::internal::Heap::RecomputeLimits(v8::internal::GarbageCollector) [node]
 7: 0xf62473  [node]
 8: 0xf632e8 v8::internal::Heap::CollectGarbage(v8::internal::AllocationSpace, v8::internal::GarbageCollectionReason, v8::GCCallbackFlags) [node]
 9: 0xf3dc3e v8::internal::HeapAllocator::AllocateRawWithLightRetrySlowPath(int, v8::internal::AllocationType, v8::internal::AllocationOrigin, v8::internal::AllocationAlignment) [node]
10: 0xf3f007 v8::internal::HeapAllocator::AllocateRawWithRetryOrFailSlowPath(int, v8::internal::AllocationType, v8::internal::AllocationOrigin, v8::internal::AllocationAlignment) [node]
11: 0xf2020a v8::internal::Factory::NewFillerObject(int, v8::internal::AllocationAlignment, v8::internal::AllocationType, v8::internal::AllocationOrigin) [node]
12: 0x12e543f v8::internal::Runtime_AllocateInYoungGeneration(int, unsigned long*, v8::internal::Isolate*) [node]
13: 0x17120b9  [node]
2024-10-11T20:31:33+0200 \u003cinfo\u003e index.js:96 (Object.duckDbCreateTableIfNotExist) DuckDB - Creating database table if not exist
2024-10-11T20:31:46+0200 \u003cinfo\u003e job.purge.js:17 (Job.purge) Deleting all background jobs created before = Fri Oct 04 2024 20:31:46 GMT+0200 (Central European Summer Time)
crashes at 18:51, 19:46, and 20:31
This RAM problem isn’t new, unfortunately, but it didn’t lead to anything, so from time to time I kill the container to restart it.
Thanks for the feedback!
Ici on parle de la “Heap Size”, ce n’est pas la même chose que la taille de la RAM disponible sur votre machine.
The Heap Size of Node.js is 2 GB by default, I believe, and you’re hitting it.
I see two options:
Either you were already close to the heap size limit and Monday’s release was just the final blow, and you reach 2 GB fairly easily which causes Gladys to crash.
Or there is a memory leak in the Gladys version released on Monday, possibly due to the update of the socket-io library, and therefore your RAM usage would increase steadily until the crash
Can you monitor your RAM usage over time? The idea would be to see whether we’re in case 1 or 2.
The idea would be to see whether the RAM usage of the Gladys container just keeps growing steadily or not!
The other option would be that Monday’s release only increased an existing memory leak…
@spenceur Regarding your issue, sorry it completely slipped my mind; I just reread the thread and it was the memory leak problem with ffmepg-fluent. Can you create a GitHub issue so I can look at it on Monday? I think we’ll move away from that library to fix this issue. Sorry again
Hello,
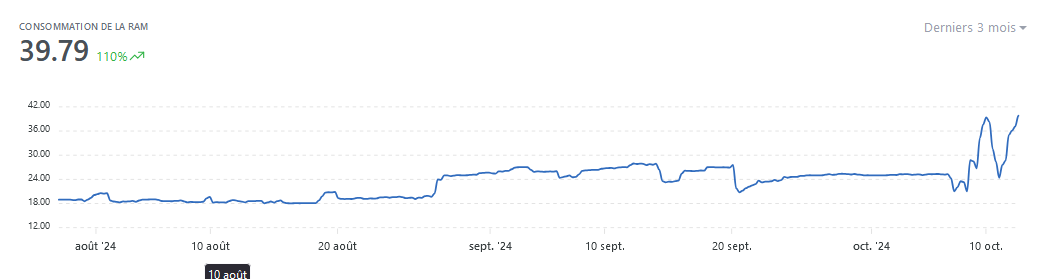
I don’t know if this will help; here is the RAM usage trend of my mini PC over the past week:
And over 3 months:
Hello,
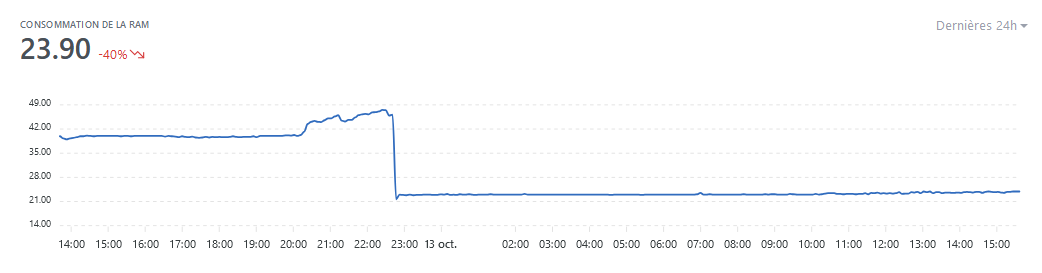
Thanks @pierre-gilles for the update and the tip to apply it immediately. I did it at 10:50 PM yesterday and the result is conclusive:
It’s back to normal
Excellent, great @PhilippeMA — if that fixes it, it was indeed an issue with the latest Socket.IO version on your end then