Hi @pierre-gilles ,
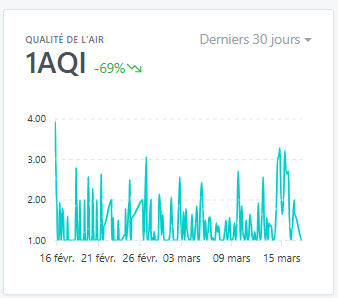
it’s not working, for example -50% is still written in red and not in green ^^
Can you show me a screenshot of your graph view?
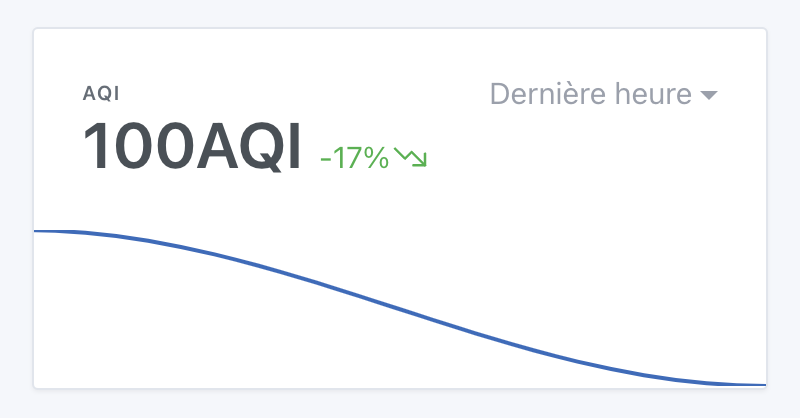
I just ran a test and I do have a variation in green:
 Warning, there must be a unit « AQI », otherwise it doesn’t work, it’s based on the unit
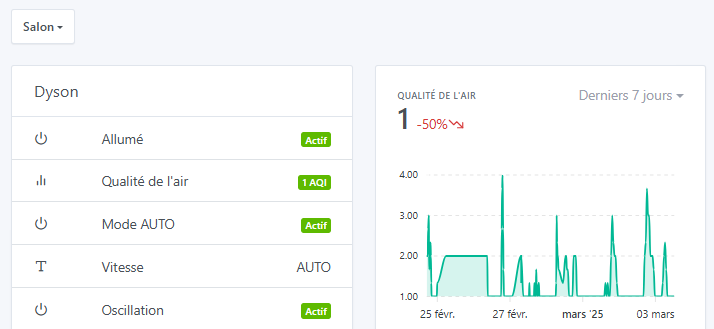
You can see on the left it’s clearly marked 1 AQI and on the right is the corresponding graph.
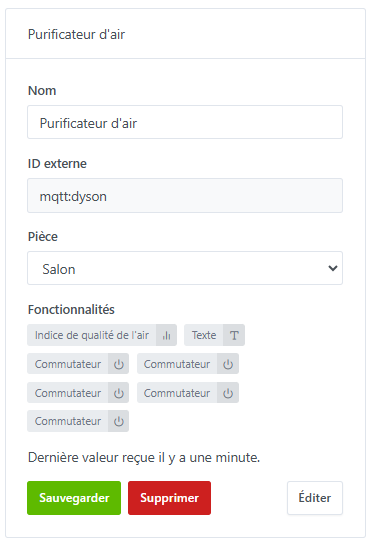
I created an MQTT device with features:
All of this is sent via Node-RED.
Thanks for your quick reply @Nagromdark, I can reproduce it — there’s actually a bug in chart editing, the unit isn’t always included.
I fixed the bug in this PR :
I’ll keep you posted when it goes to production.
@Nagromdark The bug has been fixed in Gladys Assistant 4.55!
To fix the bug, you need to modify the affected chart and deselect the problematic features, then reselect them 
Don’t hesitate if you have any questions!
@pierre-gilles I confirm the fix, thank you very much