@guim31
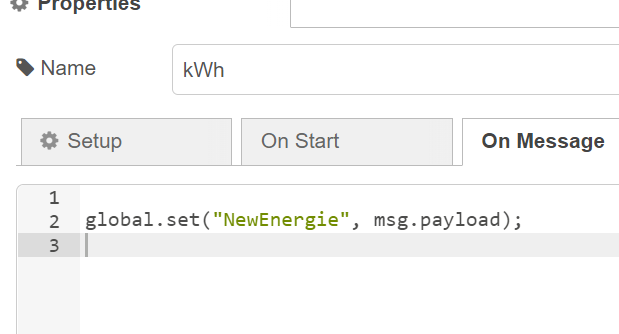
Alors pour commencer il faut que tu puisse récupérer la valeur mesuré en kWh directement dans Node-Red
Une fois que tu as cette valeur nous allons l’enregistrer dans une base de donnée Node-red via une fonction JS
Il faut ensuite que tu puisse actualiser la valeur le plus souvent possible. (Dans mon cas c’est update tous les 0.01kWh)
Pour la partie récupération des données de ton équipement de mesure c’est fini.
On passe sur Gladys, il faut créer 1 équipement MQTT (Dans mon cas “onduleur”)
Dans mon équipement j’ai créer 2 Fonctionnalitées:
Type: Inconnu
Nom: Update 10 Min
Min: 0
Max: 1
Est-ce un capteur ?: Désactivé
(Cette fonctionnalité va permettre à Gladys de dire à Node-Red d’activer une fonction que l’on va créer plus tard)
Type: Energie consommée
Nom: Energie Consommée (10 Min)
Min:0
Max: 100000
Est-ce un capteur ?: Activé
(Cette fonctionnalité va permettre de recevoir les valeurs de Node-Red vers Gladys)
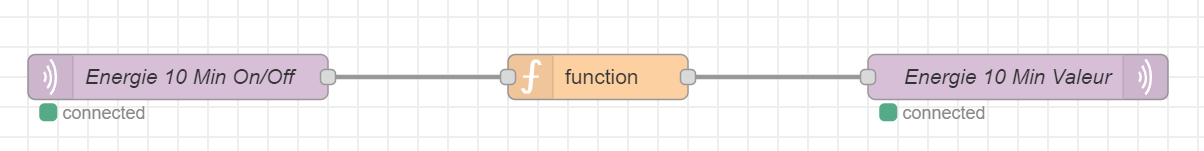
Maintenant qu’on a nos 2 fonctionnalités MQTT on va créer notre fonction dans Node-Red
A gauche c’est la fonctionnalité “Update 10 Min” avec le topic Gladys “MQTT à écouter”
A droite c’est la fonctionnalité “Energie Consommée (10 Min)” avec le topic Gladys “MQTT pour publier”
Nous avons une fonction JS au milieu
//On vérifie si la variable globale existe ou pas
if(global.get("Energie10Min") === undefined)
{
    //Si elle existe pas on la créé avec la dernière valeur mesuré (pour initialiser notre première mesure)
    global.set("Energie10Min", global.get("NewEnergie"));
}

//On calcule la différence entre la dernière valeur mesuré et la nouvelle et on arrondie à 2 chiffres après la virgule
msg.payload = (global.get("NewEnergie") - global.get("Energie10Min")).toFixed(2);

//On enregistre la nouvelle valeur en tant qu'ancienne valeur mesuré
global.set("Energie10Min", global.get("NewEnergie"));

return msg;
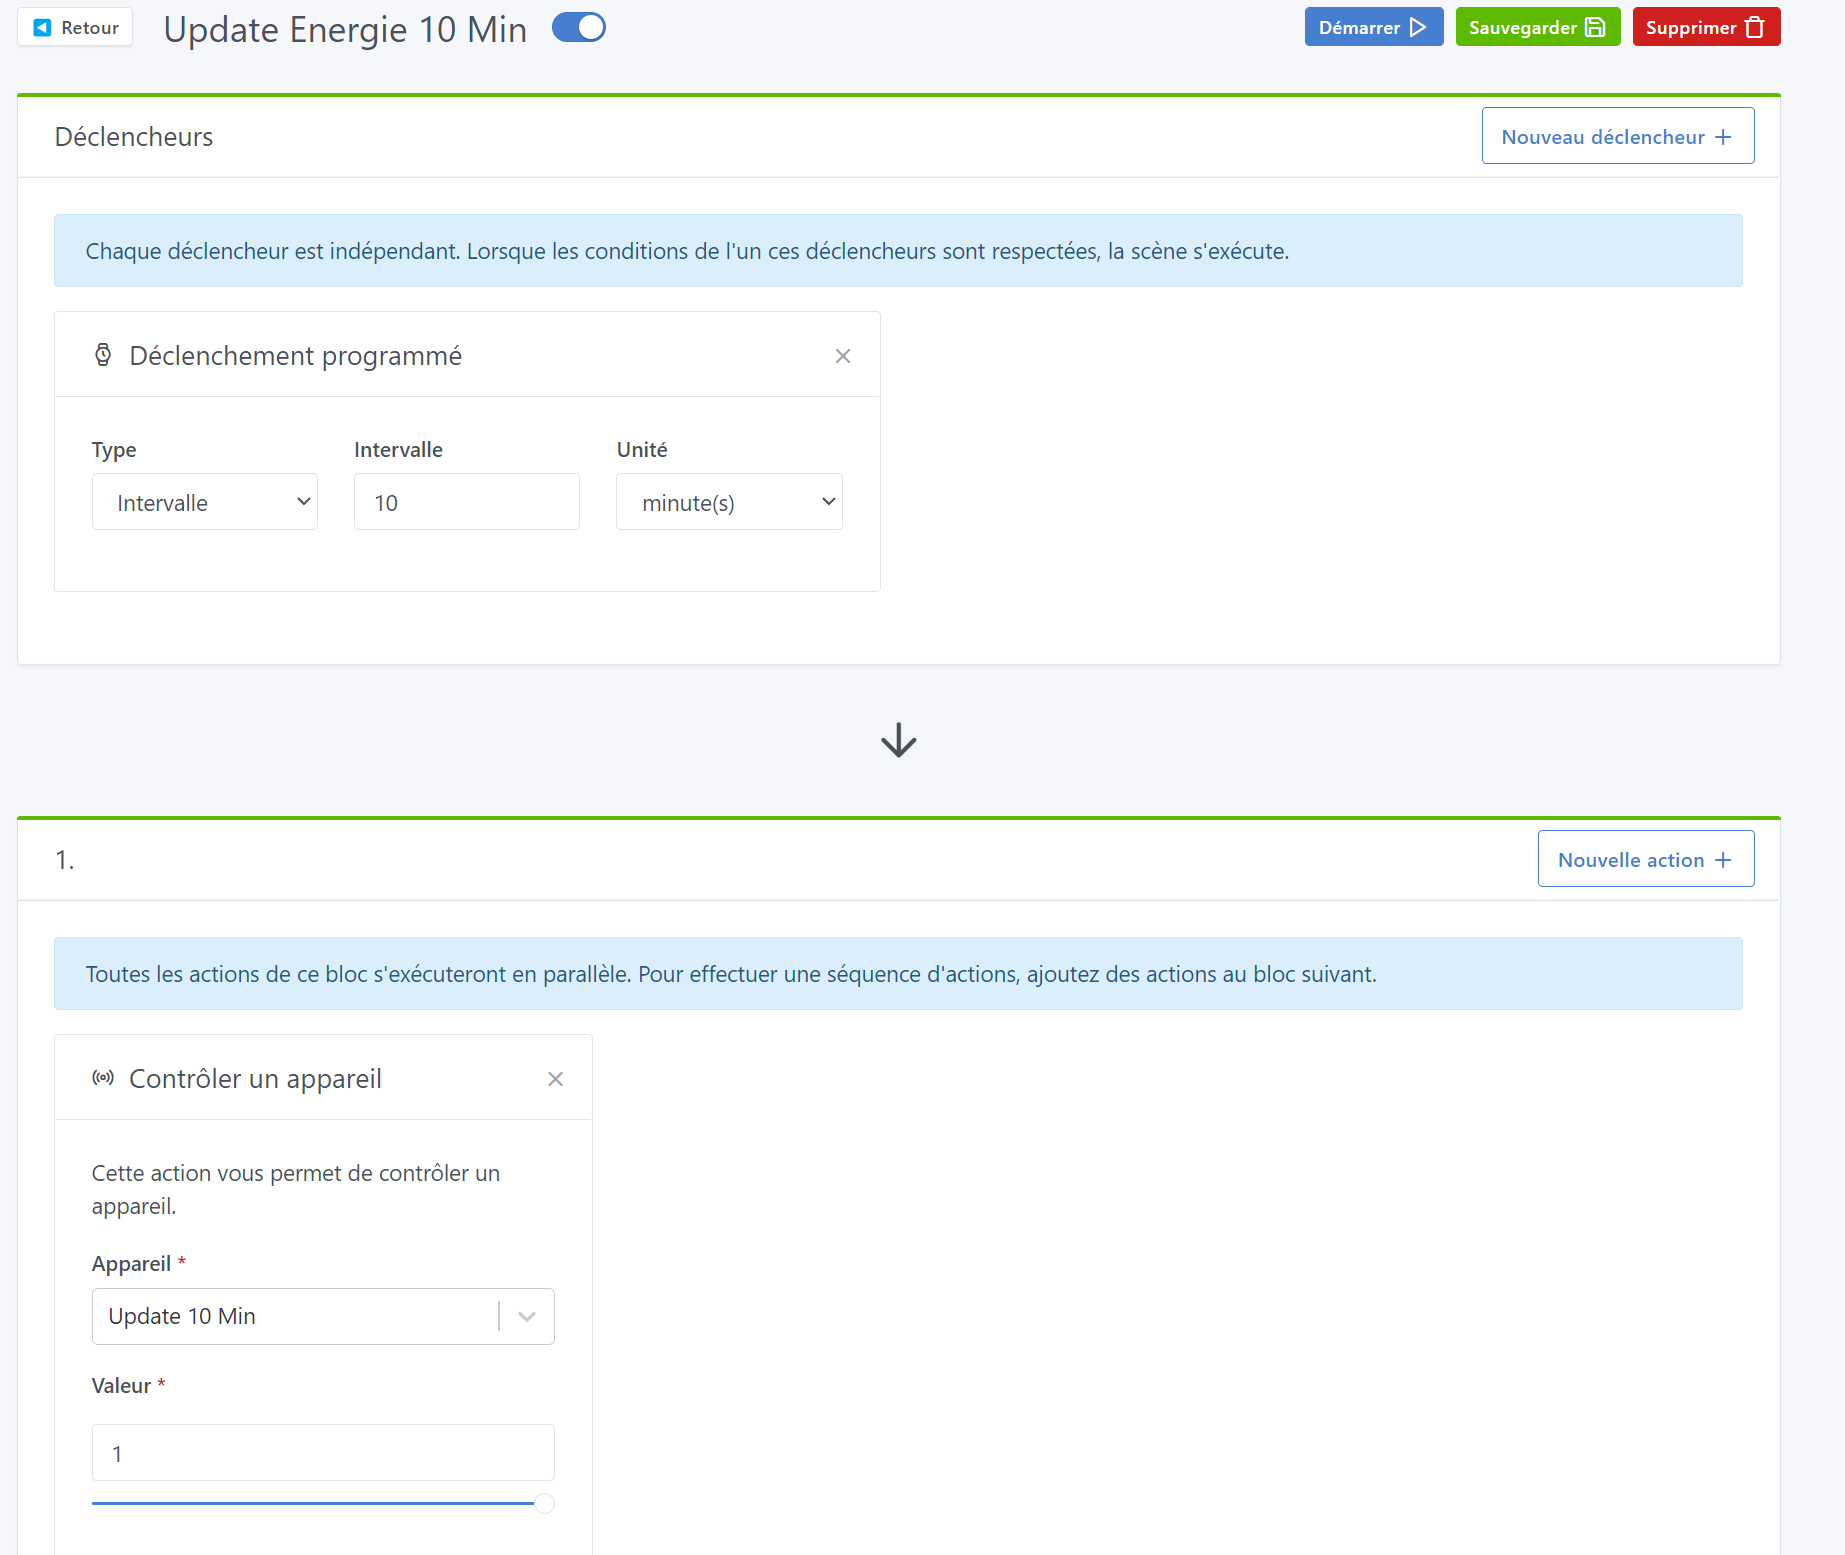
Maintenant il ne reste que la scène de déclanchement à faire dans Gladys
Si tu souhaite avoir plusieurs intervalles il te suffit de créer de nouveau 2 fonctionnalités MQTT dans ton module et de dupliquer cette partie Node-Red
En changeant toutes les informations sauf le nom de la variable “NewEnergie” dans la fonction JS car ça correspond à ta valeur actualisé automatiquement dans la première fonction JS créé plus haut
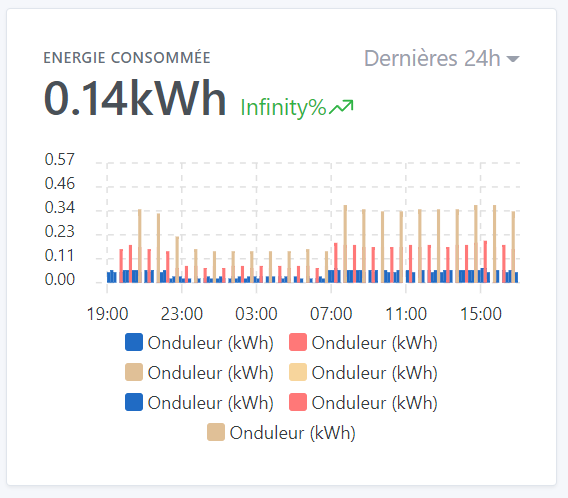
Tu peux maintenant afficher tes valeurs dans les graphiques Gladys
/!\ La première valeur reçus dans Gladys sera à 0, il faudra attendre le 2ieme relevé pour avoir les mesures
J’ai créé de mon côté les relevés suivant:
10 Min
30 Min
1 Heure
1 Jour
1 semaine
1 Mois
1 An
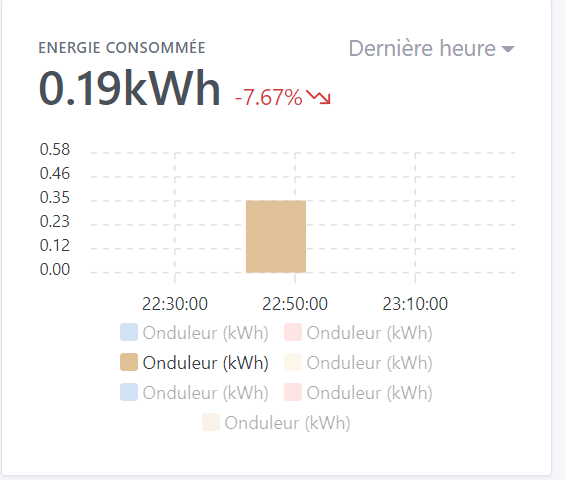
Et voila les résultats pour
10 Min
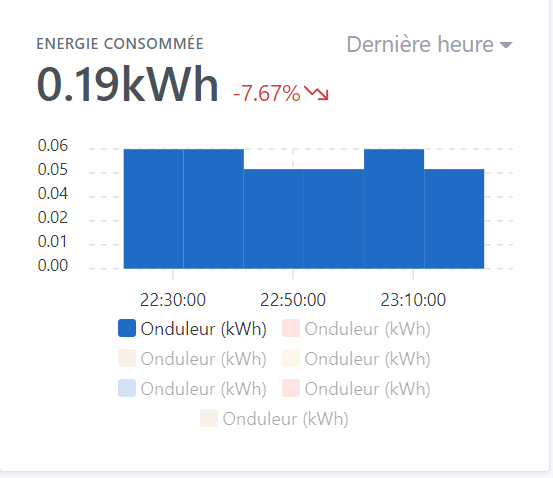
30 Min
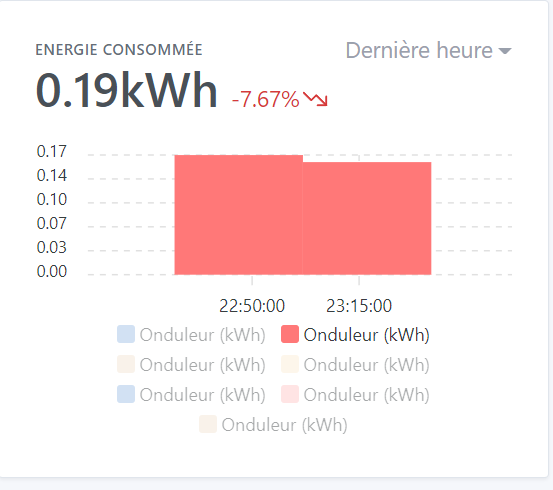
1 Heure
Tu me dis si c’est pas tout clair 
 car je rencontre le même cas de figure que toi avec ma consommation / production d’électricité.